10-K: Annual report pursuant to Section 13 and 15(d)
Published on March 13, 2014
UNITED STATES
SECURITIES AND EXCHANGE COMMISSION
Washington, D.C. 20549
____________________________________
FORM 10-K
(Mark One)
ý |
ANNUAL REPORT PURSUANT TO SECTION 13 OR 15(d) OF THE SECURITIES EXCHANGE ACT OF 1934 |
For the fiscal year ended: December 31, 2013
¨ |
TRANSITION REPORT PURSUANT TO SECTION 13 OR 15(d) OF THE SECURITIES EXCHANGE ACT OF 1934 |
For the transition period from to .
Commission File No.: 001-34705
______________________________________
Codexis, Inc.
(Exact name of Registrant as specified in its charter)
______________________________________
Delaware |
71-0872999 |
|
|
(State or other Jurisdiction of
Incorporation or Organization)
|
(I.R.S. Employer
Identification No.)
|
|
|
200 Penobscot Drive,
Redwood City, California
|
94063 |
|
(Address of Principal Executive Offices) |
(Zip Code) |
|
Registrant’s telephone number, including area code: (650) 421-8100
Securities Registered Pursuant to Section 12(b) of the Act:
Title of Each Class: |
Name of Each Exchange on which Registered: |
|
Common Stock, par value $0.0001 per share |
The NASDAQ Global Select Market |
|
Securities Registered Pursuant to Section 12(g) of the Act: None.
_______________________________________
Indicate by check mark if the registrant is a well-known seasoned issuer, as defined in Rule 405 of the Securities Act. Yes ¨ No ý
Indicate by check mark if the registrant is not required to file reports pursuant to Section 13 or Section 15(d) of the Act. Yes ¨ No ý
Indicate by check mark whether the registrant (1) has filed all reports required to be filed by Section 13 or 15(d) of the Securities Exchange Act of 1934 during the preceding 12 months (or for such shorter period that the registrant was required to file such reports), and (2) has been subject to such filing requirements for the past 90 days. Yes ý No ¨
Indicate by check mark whether the registrant has submitted electronically and posted on its corporate Web site, if any, every Interactive Data File required to be submitted and posted pursuant to Rule 405 of Regulation S-T (§ 229.405 of this chapter) during the preceding 12 months (or for such shorter period that the registrant was required to submit and post such files). Yes ý No ¨
Indicate by check mark if disclosure of delinquent filers pursuant to Item 405 of Regulation S-K is not contained herein, and will not be contained, to the best of registrant’s knowledge, in definitive proxy or information statements incorporated by reference in Part III of this Form 10-K or any amendment to this Form 10-K. ý
Indicate by check mark whether the registrant is a large accelerated filer, an accelerated filer, a non-accelerated filer or a smaller reporting company. See the definitions of “large accelerated filer,” “accelerated filer” and “smaller reporting company” in Rule 12b-2 of the Exchange Act (Check one):
Large accelerated filer |
¨ |
Accelerated filer |
ý |
|
Non-accelerated filer |
¨ |
Smaller reporting company |
¨ |
|
Indicate by check mark whether the registrant is a shell company (as defined in Rule 12b-2 of the Act). Yes ¨ No ý
The aggregate market value of voting common stock held by non-affiliates of Codexis as of June 28, 2013 was approximately
$61.2 million based upon the closing price reported for such date on The NASDAQ Global Select Market.
As of February 28, 2014, there were 38,395,862 shares of the registrant’s Common Stock, par value $0.0001 per share, outstanding.
______________________________________
DOCUMENTS INCORPORATED BY REFERENCE
Portions of the registrant’s Definitive Proxy Statement to be filed with the Commission pursuant to Regulation 14A in connection with the registrant’s 2014 Annual Meeting of Stockholders, to be filed subsequent to the date hereof, are incorporated by reference into Part III of this Report. Such Definitive Proxy Statement will be filed with the Securities and Exchange Commission not later than 120 days after the conclusion of the registrant’s fiscal year ended December 31, 2013. Except with respect to information specifically incorporated by reference in this Form 10-K, the Proxy Statement is not deemed to be filed as part of this Form 10-K.
Codexis, Inc.
Annual Report on Form 10-K
For The Year Ended December 31, 2013
INDEX
PART I |
|||
Item 1 |
|||
Item 1A |
|||
Item 1B |
|||
Item 2 |
|||
Item 3 |
|||
Item 4 |
|||
PART II |
|||
Item 5 |
|||
Item 6 |
|||
Item 7 |
|||
Item 7A |
|||
Item 8 |
|||
Item 9 |
|||
Item 9A |
|||
Item 9B |
|||
PART III |
|||
Item 10 |
|||
Item 11 |
|||
Item 12 |
|||
Item 13 |
|||
Item 14 |
|||
PART IV |
|||
Item 15 |
|||
2
SPECIAL NOTE REGARDING FORWARD-LOOKING STATEMENTS
The following discussion and analysis should be read in conjunction with our audited consolidated financial statements and the related notes that appear elsewhere in this Annual Report on Form 10-K. This Annual Report on Form 10-K contains “forward-looking statements” within the meaning of Section 21E of the Securities Exchange Act of 1934, as amended, or the Exchange Act, particularly in Part I, Item 1: “Business,” Part I, Item 1A: “Risk Factors” and Part 2, Item 7: “Management's Discussion and Analysis of Financial Condition and Results of Operations.” These statements are often identified by the use of words such as “may,” “will,” “expect,” “believe,” “anticipate,” “intend,” “could,” “should,” “estimate,” or “continue,” and similar expressions or variations. All statements other than statements of historical fact could be deemed forward-looking, including, but not limited to: any projections of financial information; any statements about historical results that may suggest trends for our business; any statements of the plans, strategies, and objectives of management for future operations; any statements of expectation or belief regarding future events, technology developments, our products, product sales, expenses, liquidity, cash flow, market growth rates or enforceability of our intellectual property rights and related litigation expenses; and any statements of assumptions underlying any of the foregoing. Such forward-looking statements are subject to risks, uncertainties and other factors that could cause actual results and the timing of certain events to differ materially from future results expressed or implied by such forward-looking statements. Accordingly, we caution you not to place undue reliance on these statements. Particular uncertainties that could affect future results include: our ability to achieve or maintain profitability; our ability to obtain substantial additional capital that may be necessary to expand our business; our dependence on a limited number of customers; our ability to develop and successfully commercialize new products for the biocatalysis markets; charges to earnings as a result of any impairment of goodwill, intangible assets or other long-lived assets; our ability to realize the expected benefits from the reduction in force we undertook in November 2013; our customers' ability to timely pay amounts owed to us; our dependence on a limited number of products in our pharmaceutical business; our ability to maintain internal control over financial reporting; our reliance on one contract manufacturer for commercial scale production of substantially all of our enzymes; our relationships with, and dependence on, collaborators in our principal markets; our ability to deploy our technology platform in the fine chemicals space; our dependence on, and need to attract and retain, key management and other personnel; the success of our customers' pharmaceutical products in the market and the ability of such customers to obtain regulatory approvals for products and processes; our ability to control and to improve pharmaceutical product gross margins; our exposure to potential third party claims resulting from a proper termination by Dyadic of our license rights for Dyadic’s commercial scale expression system for cellulases; risks associated with the international aspects of our business; our ability to integrate any businesses we may acquire with our business; our ability to accurately report our financial results in a timely manner; our ability to obtain, protect and enforce our intellectual property rights; our ability to prevent the theft or misappropriation of our biocatalysts, the genes that code for our biocatalysts, know-how or technologies; potential advantages that our competitors and potential competitors may have in securing funding or developing products; business interruptions such as earthquakes and other natural disasters; public concerns about the ethical, legal and social ramifications of genetically engineered products and processes; our ability to comply with laws and regulations; our ability to properly handle and dispose of hazardous materials used in our business; potential product liability claims; and our ability to use our net operating loss carryforwards to offset future taxable income. For a discussion of some of the factors that could cause actual results to differ materially from our forward-looking statements, see the discussion on risk factors that appear in Part I, Item 1A: “Risk Factors” of this Annual Report on Form 10-K and other risks and uncertainties detailed in this and our other reports and filings with the Securities and Exchange Commission, or SEC. The forward-looking statements in this Annual Report on Form 10-K represent our views as of the date of this Annual Report on Form 10-K. We anticipate that subsequent events and developments will cause our views to change. However, while we may elect to update these forward-looking statements at some point in the future, we have no current intention of doing so except to the extent required by applicable law. You should, therefore, not rely on these forward-looking statements as representing our views as of any date subsequent to the date of this Annual Report on Form 10-K.
3
PART I
ITEM 1. BUSINESS
Company Overview
We develop biocatalysts for the pharmaceutical and fine chemicals markets. Our proven technologies enable scale-up and implementation of biocatalytic solutions to meet customer needs for rapid, cost-effective and sustainable process development, from research to manufacturing.
Biocatalysts are enzymes or microbes that initiate and/or accelerate chemical reactions. Manufacturers have historically used naturally occurring biocatalysts to produce many goods used in everyday life. However, inherent limitations in naturally occurring biocatalysts have restricted their commercial use. Our proprietary technology platform is able to overcome many of these limitations, allowing us to evolve and optimize biocatalysts to perform specific and desired chemical reactions at commercial scale.
We have commercialized our technology and products in the pharmaceuticals market, which is our primary business focus. Our pharmaceutical customers, which include several of the largest global pharmaceutical companies, use our technology, products and services in their manufacturing process development, including in the production of some of the world's bestselling and fastest growing drugs.
We have recently begun to use our technology to develop biocatalysts for use in the fine chemicals markets. The fine chemicals market is similar to our pharmaceutical business and consists of several large market segments, including food, animal feed, polymers, flavors and fragrances and agricultural chemicals, and so it is a natural fit for our technology.
We create our products by applying our CodeEvolver® directed evolution technology platform, which introduces genetic mutations into microorganisms, giving rise to changes in the enzymes that they produce. Once we identify potentially beneficial mutations, we test combinations of these mutations until we have created variant enzymes that exhibit marketable performance characteristics superior to competitive products. This process allows us to make continuous, efficient improvements to the performance of our enzymes.
In this Annual Report, the “Company,” “we,” “us” and “our” refer to Codexis, Inc. and its subsidiaries on a consolidated basis.
Our Pharmaceutical Enzymes and Intermediates
Our pharmaceutical products include enzymes, pharmaceutical intermediates, active pharmaceutical ingredients ("APIs"), and Codex® Biocatalyst Kits and Panels. We market and sell enzymes, development services and Codex® Biocatalyst Kits and Panels screening tools that enable novel manufacturing processes for APIs and their precursor pharmaceutical intermediates. We also market and sell pharmaceutical intermediates that are manufactured using our custom enzymes. Our customers include several of the largest global pharmaceutical companies.
Our pharmaceutical products and services enable novel manufacturing processes that can lower production costs and reduce capital intensity. These products and services can provide numerous benefits to our customers, including:
• |
reducing the use of raw materials and intermediate products; |
• |
reducing the number of processing steps; |
• |
improving product yield; |
• |
using water as a primary solvent; |
• |
performing reactions at or near room temperature and pressure; |
• |
eliminating the need for certain costly manufacturing equipment; |
• |
reducing energy requirements; and |
• |
reducing the need for late-stage purification steps. |
We sell our products and services to both the generic and innovator pharmaceutical end markets. Our products and services have been adopted at various points of the pharmaceutical product lifecycle, from early-stage clinical testing to post-launch commercialization.
Our Fine Chemicals Enzymes and Intermediates
We entered the fine chemicals market in 2013, specifically through application of our biocatalysis technology in the commercial food space when we signed a joint development agreement with a market-leading food ingredients company.
4
Additionally, our technology is also currently being used by a customer to manufacture butadiene, an intermediate for the manufacture of polymers. Our existing technology is a natural fit for the fine chemical markets and we are looking to expand our opportunities to several market segments beyond the food and polymers markets, including the animal feed, agricultural chemicals and flavors and fragrances markets. In addition to developing biocatalysts processes for the manufacture of commercial goods using our biocatalysts, we also hope to satisfy our customers’ biocatalyst manufacturing and supply needs. As with our pharmaceuticals business, we also seek to market and sell intermediates that are manufactured using our custom enzymes for use in fine chemicals products.
Our Strategy
Continue growing our pharmaceutical business. We intend to pursue new collaborations in the pharmaceutical industry to integrate our products and services more deeply into drug development and manufacturing processes for clinical stage and commercially approved pharmaceutical products. As part of that effort, we will continue to market our Codex® Biocatalyst Panels and our Codex® Biocatalyst Kits aggressively to pharmaceutical companies to demonstrate the capabilities of our technology platform.
Explore commercial opportunities by leveraging our existing enzyme optimization technology. We intend to employ our existing enzyme optimization technology to explore new business opportunities outside of the pharmaceutical, food and polymers markets, including in the animal feed, agricultural chemicals and flavors and fragrances markets. Additionally, we intend to employ our existing enzyme optimization technology to develop improved therapeutic enzymes.
Improve our CodeEvolver® directed evolution technology platform. We intend to continue to improve our CodeEvolver® directed evolution technology platform, which may allow us to maintain a technology advantage over our customers and competitors. Improving our core technology capabilities should allow us to reduce the cost and time to develop new products for our customers.
Our Pharmaceutical Products and Services
Our Opportunity in the Pharmaceutical Market
The pharmaceutical industry represents a significant market opportunity for us and is our primary business focus. Pharmaceutical companies are now under significant competitive pressure both to reduce costs and to increase the speed to market for their products. To meet these pressures, pharmaceutical companies seek manufacturing processes for their new and existing drugs that reduce overall costs, simplify production and increase efficiency and product yield, while not affecting drug safety and efficacy. In addition, for pharmaceutical products whose patents have expired, the importance of cost reduction is even higher, as the manufacturers that developed those patent-protected drugs, known as innovators, compete with generic manufacturers.
The pharmaceutical product lifecycle begins with the discovery of new chemical entities and continues through preclinical and clinical development, product launch, commercial scale-up and, ultimately, patent expiration and the transition from branded to generic products. As innovators develop, produce and then market products, manufacturing priorities and processes evolve. Historically, innovators have focused on production cost reduction in the later stages of clinical development and have been reluctant to make process changes after a product has been launched. However, as pressures to reduce costs have increased, innovators have pursued cost reduction measures much earlier in the pharmaceutical product lifecycle and are increasingly looking for opportunities to improve their operating margins, including making manufacturing process changes for marketed products after the products have been launched if these changes can result in significant cost reductions. As a result, innovators are investing in new technologies to improve their manufacturing productivity and efficiency or outsourcing the manufacture of their intermediates and active pharmaceutical ingredients, or APIs.
Our Solution for the Pharmaceutical Market
Our CodeEvolver® directed evolution technology platform enables us to deliver solutions to our customers in the pharmaceutical market by developing and delivering optimized enzymes that perform chemical transformations at a lower cost and improve the efficiency and productivity of manufacturing processes. We provide value throughout the pharmaceutical product lifecycle. Our pharmaceutical products and services allow us to provide benefits to our customers in a number of ways, including:
• |
reducing the use of raw materials and intermediate products; |
• |
reducing the number of processing steps; |
• |
improving product yield; |
5
• |
using water as a primary solvent; |
• |
performing reactions at or near room temperature and pressure; |
• |
eliminating the need for certain costly manufacturing equipment; |
• |
reducing energy requirements; |
• |
reducing the need for late-stage purification steps; |
• |
eliminating multiple steps in the manufacturing process; and |
• |
eliminating hazardous inputs and harmful emission by-products. |
Early in the product lifecycle, customers can use our products and services to achieve speed to market and to reduce manufacturing costs. If an innovator incorporates our products or processes into an FDA-approved product, we expect the innovator to continue to use these products or processes over the patent life of the approved drug.
After a product is launched, customers also use our products and services to reduce manufacturing costs. At this stage, changes in the manufacturing process originally approved by the FDA may require additional regulatory review. Typically, pharmaceutical companies will only seek FDA approval for a manufacturing change if there are substantial cost savings associated with the change. We believe that the cost savings associated with our products may lead our customers to change their manufacturing processes for approved products and, if necessary, seek FDA approval of the new processes which incorporate our enzymes. Moreover, we believe these cost savings are attractive to generics manufacturers, who compete primarily on price.
Pharmaceutical Products and Services
Codex® Biocatalyst Panels and Kits. We sell Codex® Biocatalyst Panels and Kits to customers who are engaged in both drug development and the marketing of approved drugs to allow them to screen and identify possible enzymatic manufacturing processes for their drug candidates and their marketed products. Codex® Biocatalyst Panels are tools that provide genetically diverse variants of our proprietary enzymes, which allow our customers to determine whether an enzyme produces a desired activity that is applicable to a particular process. Codex® Biocatalyst Kits provide subsets of the Codex® Biocatalyst Panel enzymes in individual vials for the same purpose.
For compounds that are in development, Codex® Biocatalyst Panels and Kits:
• |
allow innovators to screen and identify possible enzymatic manufacturing processes rapidly and inexpensively for many of their drug candidates in-house, without the risks of disclosing the composition of their proprietary molecules before they have received patent protection; and |
• |
generate data that we can use to optimize enzymes rapidly for a particular reaction, if necessary, reducing the time required to generate a manufacturing process capable of supporting clinical trials with inexpensively produced, pure drugs. |
We believe that our Codex® Biocatalyst Panels and Kits have helped us build early and broad awareness of the power and utility of our technology platform, and will increasingly lead to sales of our enzymes and enzyme optimization services, as well as intermediates and APIs made using our enzymes. Many of our pharmaceutical customers, which include several of the largest global pharmaceutical companies, have used our Codex® Biocatalyst Panels and Kits. If our customers incorporate an enzymatic manufacturing process early in a product's lifecycle, they can reduce their manufacturing costs throughout that lifecycle, while we, in turn, could realize a long term revenue stream resulting from the use of our enzymes during that time. In addition, Codex® Biocatalyst Panels and Kits are increasingly used by our customers to evaluate the feasibility of changing the manufacturing process for their marketed products to an enzyme-enabled process.
Enzyme screening services. If a customer prefers, rather than subscribing to our Codex® Biocatalyst Panels or Kits to use for their own screening, they can send us their materials to test against our existing libraries of enzymes. If we detect desired activity in a specific enzyme, we can supply the customer with this enzyme or perform optimization services to improve the performance of the enzyme.
Our screening services:
• |
allow innovators to screen and identify possible enzymatic manufacturing processes rapidly and inexpensively through access to our extensive enzyme libraries; and |
• |
generate data that we can use to optimize enzymes rapidly for a particular reaction, if necessary, reducing the time required to generate a manufacturing process capable of supporting the customers' particular needs, ranging from small quantities for clinical trials to full commercial production, in all cases providing inexpensively produced, pure drugs. |
6
We have provided screening services to numerous innovator and generic pharmaceutical manufacturers.
Enzyme optimization services. We work with our customers throughout the pharmaceutical product lifecycle to customize enzymes, resulting in optimized enzymes that have been evolved specifically to perform a desired process according to a highly selective set of specifications.
Our enzyme optimization services:
• |
allow innovators to improve the manufacturing process as their drug candidates progress through preclinical and clinical development, in some cases deferring or reducing the need for significant manufacturing investment until the likelihood of commercial success is more certain; and |
• |
enable manufacturing processes that are highly efficient, inexpensive, require relatively little energy, reduce the need for hazardous reagents and reduce waste. For example, our activities with Pfizer have included developing an optimized enzymatic manufacturing process for a key intermediate that eliminates three chemical steps from the conventional chemical manufacturing process. |
Enzymes. We supply varying quantities of our enzymes to pharmaceutical companies, from small to moderate quantities while they are optimizing their production processes, to larger quantities during later-stage clinical development and commercial scale drug production.
Our enzymes:
• |
enable innovators to manufacture products more efficiently during preclinical and clinical development using optimized enzymatic processes, with relatively low investment; |
• |
eliminate the need for innovators to invest in the development of complex chemical synthesis routes during the development stage; |
• |
allow innovators to achieve higher product purity during the development stage prior to investing in expensive late-stage clinical trials; |
• |
reduce the risk of adverse effects arising from product impurities; |
• |
allow the removal of entire steps from synthetic chemical production routes during commercial scale production, reducing raw material costs, energy requirements and the need for capital expenditures; and |
• |
decrease the manufacturing costs for our customers. |
For instance, as a part of our ongoing collaboration with Merck, we have developed an enzyme for use in a new manufacturing process for sitagliptin, the API in Merck's pharmaceutical product Januvia®. Januvia® is Merck's first-in-class medication for the treatment of Type II diabetes. We have also entered into commercial arrangements with several leading contract manufacturing organizations, or CMOs, including Royal DSM N.V., or DSM, Dishman Pharmaceuticals and Chemicals, Ltd., and AMPAC, under which these CMOs can use our enzymes in their manufacturing processes.
Intermediates and APIs. We can supply our customers with intermediates and APIs made using our enzymes throughout the drug lifecycle.
Our supply of intermediates has the following uses and benefits:
• |
lowers capital investment for innovators through outsourcing of manufacturing; and |
• |
provides a source of less expensive, more pure products to innovator and generics manufacturers. |
We have developed enzymes for use in the manufacture of certain generic intermediates and APIs by various companies, including Teva Pharmaceutical Industries Ltd., or Teva. In addition, we market several intermediates and APIs for the generic equivalents of branded pharmaceutical products for sale in markets where innovators have not sought patent protection for their products and intend to sell these same intermediates and APIs for use in markets where innovators have sought patent protection when the patent protection for each product expires.
For the years ended December 31, 2013, 2012 and 2011, revenues for our statin-family of products contributed approximately 11%, 24% and 24%, respectively, of our total revenues and our sales of products used in hepatitis C therapies were approximately 19%, 10% and 9%, respectively, of our total revenues for those periods.
Pharmaceutical Business Model
We typically enter into research collaborations with our pharmaceutical customers. These agreements often contain service and intellectual property provisions under which we research and develop optimized enzymes for innovator pharmaceutical companies in connection with their drug development efforts. In these collaborations, we typically receive revenues in the form
7
of one or more of the following: up-front payments, milestone payments, payments based upon the number of full-time employee equivalents, or FTEs, engaged in related research and development activities and licensing fees and royalties.
Our pharmaceutical products include enzymes, pharmaceutical intermediates, active pharmaceutical ingredients, or APIs, and Codex® Biocatalyst Panels and Kits. We sell our products primarily to pharmaceutical manufacturers through our direct sales and business development force in the United States and Europe.
Our Fine Chemicals Products and Services
We entered the fine chemicals market in 2013, specifically through application of our biocatalysis technology in the commercial food space when we signed a joint development agreement with a market-leading food ingredients company. Additionally, our technology is also currently being used by a customer to manufacture butadiene, an intermediate for the manufacture of polymers. Our existing technology is a natural fit for the fine chemical markets and we believe that we are able to significantly leverage the technological innovations that we have developed in our pharmaceutical business to the fine chemicals market in order to provide fine chemicals customers with similar enzyme development and services as we currently provide to our pharmaceutical customers.
We are looking to expand our fine chemicals opportunities beyond the food and polymers markets, including into the animal feed, agricultural chemicals and flavors and fragrances markets. In addition to developing biocatalyst processes for the manufacture of commercial fine goods using our biocatalysts for the fine chemicals markets, we also hope to satisfy our fine chemicals customers’ biocatalyst manufacturing and supply needs. As with our pharmaceuticals business, we also seek to market and sell intermediates that are manufactured using our custom enzymes for use in fine chemicals products.
Technology
We engineer custom enzymes and microorganisms, which we sometimes refer to as biocatalysts. In simple terms, our biocatalysts initiate or accelerate chemical reactions. We use our CodeEvolver® directed evolution technology platform, which includes enzyme engineering, metabolic pathway engineering and fermentation microbe improvement, to develop novel enzymes and microorganisms that enable industrial biocatalytic reactions and fermentations. Our technology platform has enabled commercially viable products and processes for the manufacture of pharmaceutical intermediates and end products.
Our approach to developing commercially viable biocatalytic processes begins by conceptually designing the most cost-effective and practical manufacturing process for a targeted product. We then develop optimized biocatalysts to enable that process design, using our directed evolution technology, including screening and validating biocatalysts under relevant conditions. Typical design criteria include stability in the desired reaction conditions, biocatalyst activity and productivity (yield), ease of product isolation, product purity and cost. Alternative approaches to biocatalytic process development typically involve designing and engineering the biocatalytic processes around shortcomings of available biocatalysts, including, for example, biocatalyst immobilization (for stability and/or reuse), special equipment and costly product isolation and purification methods. We circumvent the need for these types of costly process design features by optimizing the biocatalyst for fitness in the desired process environment. As a result, we enable and develop cost-efficient processes that typically are relatively simple to run in conventional manufacturing equipment. This also allows for the efficient technical transfer of our process to our manufacturing partners.
The successful embodiment of our CodeEvolver® directed evolution technology platform in commercial manufacturing processes requires well-integrated expertise in a number of technical disciplines. In addition to those directly involved in practicing our directed evolution technologies, such as molecular biology, enzymology, microbiology, cellular engineering, metabolic engineering, bioinformatics, biochemistry, and high throughput analytical chemistry, our process development projects also involve integrated expertise in organic chemistry, chemical process development, chemical engineering, fermentation process development, and fermentation engineering. Our integrated, multi-disciplinary approach to biocatalyst and process development is a critical success factor for our company.
Enzyme Optimization Overview
The enzyme optimization process starts by identifying genes that code for enzymes known to have the general type of catalytic reactivity for a desired chemical reaction. Typically, we identify gene sequences in published databases and then synthesize candidate genes having those sequences. Using a variety of biotechnology tools, we diversify these genes by introducing mutations, giving rise to changes in the enzymes for which they encode. The methods for diversifying these genes, and types of diversity being tested, often vary over the course of an enzyme optimization program. For finding initial diversity, methods typically include random mutagenesis and site-directed (included structure-guided) mutagenesis. We also test mutational variations that distinguish related enzymes among different organisms. Once we have identified potentially beneficial
8
mutations, we test combinations of these mutations in libraries made using our proprietary gene recombination methodologies, gene shuffling and multiplexed gene SOEing, or Splicing by Overlap Extension.
With our proprietary gene shuffling methodology, we generate libraries of genes that have random combinations of the mutations we are testing. The pool of genes is used to transform host cells, which entails introducing the various genes, one by one, into host cells. These cells are then segregated and grown into colonies. Cells from individual colonies are cultured in high throughput to produce the enzyme encoded by the shuffled gene in those cells. The enzymes are then screened in high throughput using test conditions relevant to the desired process. The screening results identify individual shuffled genes that produce improved enzymes having combinations of beneficial mutations and weed out enzymes having detrimental ones. Using different test conditions and/or different analytical methods, we can identify variant enzymes that exhibit various improved performance characteristics, such as stability, activity and selectivity, under conditions relevant to the desired chemical process.
In the next step in our optimization process, we use our proprietary software tools, ProSAR™ and MOSAIC™ to analyze protein sequence-activity relationships. ProSAR™ aids in identifying specific gene and enzyme mutations that are beneficial, neutral or detrimental with respect to the desired performance characteristics. MOSAIC™ aids in identifying functionally interacting mutations within a specific gene or enzyme that are beneficial, neutral or detrimental with respect to the desired performance characteristics. Earlier directed evolution methods did not separately evaluate individual mutations in libraries of variants which carry multiple mutations, where beneficial and detrimental performance characteristics may be mixed in an individual gene or enzyme. Capitalizing on the advent of inexpensive gene sequencing, we are able to determine which particular mutations are present in the genes and proteins we have screened. Our ProSAR™ and MOSAIC™ bioinformatics software relates the screening results to the mutations and ranks the individual mutations (ProSAR™) and interacting mutations (MOSAIC™) with regard to their degree of benefit or detriment, relative to whichever process parameter(s) the screening tested. Using that information, we can bias the pool of mutational diversity in the next iteration to further the accumulation of beneficial diversity and cancel out detrimental diversity in the individual genes in the resulting shuffled library. The results from both ProSAR™ and MOSAIC™ also help us develop ideas about new diversity to test. ProSAR™ and MOSAIC™, combined with efficient gene synthesis and high quality library generation methods, have led to a significant increase in the efficiency and speed of enzyme improvement and optimization.
In another step of our optimization process, we take the best variants we have identified and prepare small amounts of each to test in the desired chemical process at laboratory scale, for in-process confirmation. This optimization routine is done iteratively, typically adding new diversity to the pool in each iteration. The gene that codes for the best performing enzyme in one iteration is used as the starting gene for the next iteration of shuffling and screening. As the enzymes improve over these iterations, the screening conditions are made increasingly more stringent. In this way, enzymes are rapidly optimized until all in-process performance requirements have been achieved and the economic objectives for the desired process have been met.
Multiplexed gene SOEing is our proprietary methodology for rapidly generating gene variants. Using multiplexed gene SOEing, we rapidly generate collections of individual gene variants that have predetermined, as opposed to random, combinations of mutations we are testing. It is based on a biotechnology technique, which we refer to as SOEing, generally used to make a hybrid, or spliced, gene from fragments of two genes and/or to introduce a specific mutation into a splice between fragments of one gene. We have automated the process to make robotically, in parallel, one hundred to several hundred variants, each with a predetermined combination of the mutations we are testing. The variants are introduced into host cells, and the encoded enzyme is produced and screened in high throughput, as described above.
Using multiplexed gene SOEing, we can test many mutations and combinations thereof in parallel, and because the mutation incorporation is controlled and predetermined before screening, as opposed to random incorporation and selection after screening, the resulting data set can be more optimal for ProSAR™ analysis.
We believe using multiplexed gene SOEing to survey many mutations quickly, followed by ProSAR™ and MOSAIC™-driven shuffling of beneficial mutations, is a particularly effective approach, providing rapid gains in enzyme performance.
Codex® Biocatalyst Panels and Kits
Codex® Biocatalyst Panels were initially developed to speed our own internal process for identifying enzymes with desired characteristics for further optimization. Each Codex® Biocatalyst Panel is comprised of variants of one or more enzymes that catalyze one type of a generally useful chemical reaction. We assemble, on one or more multi-well sample plates, variants of a parent enzyme that we pre-optimize for stability in industrial chemical processes and for ready manufacturability. The variants are diversified to react to a variety of chemical structures that are susceptible to that type of chemical reaction.
9
Either we or our innovator pharmaceutical customers use the Codex® Biocatalyst Panels to screen a new chemical structure against the assembled variants to identify variants that react with the new chemical structure rapidly. For some new structures, a variant on the panel could enable production of the desired product. We can also analyze the data from the panel screen using ProSAR™ to identify the mutations that are beneficial for the reaction of the new structure and further optimize the enzyme as needed using the enzyme optimization techniques described above. In cases where a customer wishes to screen a proprietary new chemical structure itself, we can produce a custom panel of new variants on a sample plate produced by multiplexed gene SOEing.
In 2010, we launched Codex® Screening Kits as an alternative format to provide our enzymes to pharmaceutical development laboratories that are not equipped to use multi-well sample plates. The enzymes are instead individually provided in vials for the researchers to sample.
Microbe Optimization using Gene Optimization
For fermentation microbes, we enhance metabolic pathways by using gene optimization to improve the production and/or productivity of one or more enzymes in a series of in vivo reactions that make a desired product. We optimize the gene/enzyme as described above using either in vitro or in vivo screening. For fermentation applications, the microbes containing the improved gene(s) are directly evaluated in laboratory scale fermenters.
The metabolic pathway may naturally exist in the microbe, but productivity and/or selectivity improvements are needed to produce more of the desired natural product and/or less of an undesired by-product economically. We can also introduce a new metabolic pathway to produce a desired product using our gene shuffling technology in combination with synthetic biology, a type of metabolic engineering in which new genes are introduced into a microbe.
Microbe Optimization using Whole Genome Shuffling
In addition to our gene optimization technology for enzymes, we have another complimentary technology in our platform for the optimization of fermentation microbes called Whole Genome Shuffling. Whole Genome Shuffling allows us to improve the performance of a fermentation microbe by shuffling unidentified mutations in unidentified genes across the genome. We start with a diversity of mutational variants of a fermentation organism, generated by conventional means such as random mutagenesis. Our Whole Genome Shuffling involves introducing the entire genome of two or more such cells into a single cell, in which the genetic machinery of the combined cell recombines, or shuffles, the genomes. In one method, this is accomplished by protoplast fusion, in which the cell walls are removed to leave the cells' contents contained only by their cell membranes. The cell membranes of these protoplasts in the diverse population are induced to fuse together into fusants containing the genome of two or more of the parent cells. From these fusants, we regenerate normal cells, each with one copy of a hybridized genome. Microbial colonies are then grown and screened for their performance in the fermentative production of the desired product. This process can be repeated, including with the introduction of new mutations, until the desired performance in the fermentation process is achieved. One of our collaborators is operating a fermentation process for a generic pharmaceutical product using microbes we developed by Whole Genome Shuffling.
Metabolic Engineering and Synthetic Biology
In addition to our proprietary enzyme and microbe optimization technologies, we have built expert capabilities in a suite of metabolic engineering technologies for the development and optimization of fermentation microbes. These technologies are generally applicable to our pathway and strain engineering programs. Genomics, transcriptomics, proteomics and metabolomics all provide more in-depth analyses of the metabolic functioning of fermentation microbes, and differences between variants, to guide further improvements. In many cases, these analyses help to identify enzymes that need to be modified (removed, increased, stabilized or otherwise modified) in order to increase the overall productivity and performance of the strain.
Synthetic biology involves the design, synthesis and introduction of new genetic programming to organisms for new biological functions. This field has rapidly developed in recent years as DNA synthesis and sequencing costs have rapidly dropped. Using synthetic biology, we are taking advantage of the publicly available gene and genome sequence information in our gene and metabolic pathway optimization projects. This information is being leveraged by our ProSAR™ and MOSAIC™ software and multiplexed gene SOEing methodologies.
Intellectual Property
Our success depends in large part on our ability to protect our proprietary products and technology under patent, copyright, trademark and trade secret laws. We also rely heavily on confidential disclosure agreements for further protection of our
10
proprietary products and technologies. Protection of our technologies is important for us to offer our customers and partners proprietary services and products that are not available from our competitors, and to exclude our competitors from practicing technology that we have developed or exclusively licensed from other parties. For example, our ability to supply innovator pharmaceutical manufacturers depends on our ability to supply proprietary enzymes or methods for making pharmaceutical intermediates or APIs that are not available from our competitors. Likewise, in the generic pharmaceutical area, proprietary protection, through patent, trade secret or other protection of our enzymes and methods of producing a pharmaceutical product is important for us and our customers to maintain a lower cost production advantage over competitors. As of December 31, 2013, we owned or controlled approximately 394 issued patents and approximately 301 pending patent applications in the United States and in various foreign jurisdictions. These patents and patent applications are directed to our enabling technologies and specific methods and products that support our business in the pharmaceutical markets. The earliest that any of our intellectual property rights will expire is 2014. The issued patents covering our fundamental shuffling technologies have terms ending as late as 2019. Our United States intellectual property rights directed to our second generation enabling technologies have terms that expire from 2021 to 2034. We continue to file new patent applications, for which terms generally extend 20 years from the filing date in the United States.
In October 2010, we acquired substantially all of the patents and other intellectual property rights associated with Maxygen, Inc.'s, or Maxygen, directed evolution technology, known as the MolecularBreeding™ technology platform, including patents, trademarks, copyrights, software and certain assumed contracts. Prior to this transaction, we and Maxygen were parties to a license agreement pursuant to which Maxygen granted us a worldwide, exclusive license to certain Maxygen intellectual property related to the use of directed evolution technology in a variety of fields of use. Since we now own substantially all of the intellectual property rights subject to the original license, the original license with Maxygen has been terminated. The intellectual property rights and assets that we acquired from Maxygen will continue to be subject to existing license rights previously granted by Maxygen to third parties, including Perseid Therapeutics LLC, or Perseid, and to Novozymes A/S, or Novozymes. Perseid retains exclusive licenses to use the intellectual property for the discovery, research and development of protein pharmaceuticals. We and Novozymes enjoy co-exclusive rights in certain fields, including biofuels. Novozymes did not receive a license to all of the rights we were using for biofuels applications and which we believe are critical to pursuing such applications. Novozymes also has exclusive rights to certain of the intellectual property that we acquired from Maxygen in certain limited fields, including development, production and sales of industrial proteins for use in processes for textile, garment, leather, wood and paper production, certain starch, food and animal feed production, certain personal care products, oil drilling, dyestuffs and dyeing and electronics industry waste water treatment.
As part of the transaction with Maxygen, we entered into a new license agreement with Maxygen, pursuant to which we granted to Maxygen certain license rights to the intellectual property assets that we acquired to the extent necessary for Maxygen to fulfill its contractual obligations under the license agreements retained by Maxygen.
We will continue to file and prosecute patent applications and maintain trade secrets in an ongoing effort to protect our intellectual property. It is possible that our current patents, or patents which we may later acquire, may be successfully challenged or invalidated in whole or in part. It is also possible that we may not obtain issued patents from our pending patent applications or other inventions we seek to protect. We sometimes permit certain intellectual property to lapse or go abandoned under appropriate circumstances. Due to uncertainties inherent in prosecuting patent applications, sometimes patent applications are rejected and we subsequently abandon them. It is also possible that we may develop proprietary products or technologies in the future that are not patentable or that the patents of others will limit or altogether preclude our ability to do business. In addition, any patent issued to us may provide us with little or no competitive advantage, in which case we may abandon such patent or license it to another entity.
Our registered and pending United States and foreign trademarks include Codexis®, Codex®, CodeEvolver®, CodeXporter®, CodeXol®, CodeXyme®, Powered by CodeEvolver®, We Are Biocatalysis™, Mosaic™, Sage™, Microcyp™, Hit from a Kit™, Prosar™ and a Codexis and design mark (i.e., the Codexis logo).
Our means of protecting our proprietary rights may not be adequate and our competitors may independently develop technology or products that are similar to ours or that compete with ours. Patent, trademark, and trade secret laws afford only limited protection for our technology platform and products. The laws of many countries do not protect our proprietary rights to as great an extent as do the laws of the United States. Despite our efforts to protect our proprietary rights, unauthorized parties have in the past attempted, and may in the future attempt, to operate under aspects of our intellectual property or products or to obtain and use information that we regard as proprietary. Third parties may also design around our proprietary rights, which may render our protected technology and products less valuable, if the design around is favorably received in the marketplace. In addition, if any of our products or technology is covered by third-party patents or other intellectual property rights, we could be subject to various legal actions. We cannot assure you that our technology platform and products do not infringe patents held by others or that they will not in the future.
11
Litigation may be necessary to enforce our intellectual property rights, to protect our trade secrets, to determine the validity and scope of the proprietary rights of others, or to defend against claims of infringement, invalidity, misappropriation, or other claims. Any such litigation could result in substantial costs and diversion of our resources. Moreover, any settlement of or adverse judgment resulting from such litigation could require us to obtain a license to continue to make, use or sell the products or technology that is the subject of the claim, or otherwise restrict or prohibit our use of the technology.
Former Biofuels and Bioindustrial Programs
In November 2013 we announced that we were winding down our CodeXyme® cellulase enzymes program, and that we had stopped development of our CodeXol® detergent alcohols program. These decisions relating to our biofuels and bioindustrial programs have allowed us to re-direct our resources to other opportunities for our technology in other fields, including the fine chemicals field.
Competition
Overview
We face differing forms of competition in the pharmaceuticals and fine chemicals markets, as set forth below:
Pharmaceuticals
Our primary competitors in the biocatalysis market for pharmaceutical products are companies using conventional, non-enzymatic processes to manufacture pharmaceutical intermediates and APIs that compete in the marketplace with our enzymatically manufactured products. The principal methods of competition and competitive differentiation in this market are product quality and performance, including manufacturing yield and safety and environmental benefits, speed of delivery of product and price. The market for the manufacture and supply of APIs and intermediates is large with many established companies. These companies include many of our large innovator and generic pharmaceutical customers, such as Merck, Pfizer, Bristol Myers Squibb and Teva, who have significant internal research and development efforts directed at developing processes to manufacture APIs and intermediates. The processes used by these companies include classical conventional organic chemistry reactions, chemo catalysis reactions catalyzed by chemical catalysts, or biocatalytic routes using commercially available enzymes, or combinations thereof. Our manufacturing processes must compete with these internally developed routes. Additionally, we also face competition from companies such as Solvias Inc. and Takasago International Corporation who use metal-based chemical reactions for their pharmaceutical products, rather than a biocatalytic process. Finally, we face increasing competition from generic pharmaceutical manufacturers in low cost centers such as India and China.
The market for supplying enzymes for use in pharmaceutical manufacturing is quite fragmented. There is competition from large industrial enzyme companies, such as Novozymes, as well as subsidiaries of larger pharmaceutical companies, such as DSM, Cambrex Corporation and Almac Group Ltd. There is also competition in the customized and optimized enzyme area from several small European companies, such as BRAIN AG, C-LEcta GmbH and evocatal GmbH.
We believe that our principal advantage is our ability to rapidly deliver customized enzyme products for existing and new intermediates and APIs in the pharmaceuticals market. This capability has allowed us to create a breadth of products with improved performance characteristics including, for example, activity, stability, and activity on a range of substrates, compared to traditional chemistry-based manufacturing processes and naturally occurring biocatalysts. We believe that our directed evolution technology provides substantially superior results, in shorter time frames, than companies offering competing biocatalyst development services.
Fine Chemicals
We entered the fine chemicals market in 2013, namely applying our biocatalysis technology in the food and solvents markets. We face similar forms of competition in this market as in the pharmaceutical markets, with the exceptions that our fine chemicals customers do not have the in-house biocatalysis capabilities that our pharmaceutical customers have and the risk of losing out on opportunities to larger competitors in fine chemicals is greater given the larger scale of opportunities available in the fine chemicals markets compared to the pharmaceutical market. Our significant competitors in the fine chemical markets include companies that have been in these marketplaces for many years, such as Dupont-Genencor, DSM, Novozymes and A.B. Enterprises. These companies have greater resources in these markets than we do and have long-term supply arrangements already in place with customers. Our ability to compete in these markets may be limited by our relatively late start.
Core Technology
12
We are a leader in the field of directed molecular evolution of biocatalysts. Both our pharmaceuticals and fine chemicals businesses rely on our core technology. We are aware that other companies, including DSM, have alternative methods for obtaining and generating genetic diversity or use mutagenesis techniques to produce genetic diversity. Academic institutions such as the California Institute of Technology, the Max Planck Institute and the Center for Fundamental and Applied Molecular Evolution (FAME), a jointly sponsored initiative between Emory University and Georgia Institute of Technology, are also working in this field. This field is highly competitive and companies and academic and research institutions are actively seeking to develop technologies that could be competitive with our technologies.
We are aware that other companies, organizations and persons have developed technologies that appear to have some similarities to our patented proprietary technologies. In addition, academic institutions are also working in this field. Technological developments by others may result in our products and technologies, as well as products developed by our customers using our biocatalysts, becoming obsolete. We monitor publications and patents that relate to directed molecular evolution to be aware of developments in the field and evaluate appropriate courses of action in relation to these developments.
Many of our competitors have substantially greater manufacturing, financial, research and development, personnel and marketing resources than we do. In addition, certain of our competitors may also benefit from local government subsidies and other incentives that are not available to us. As a result, our competitors may be able to develop competing and/or superior technologies and processes, and compete more aggressively and sustain that competition over a longer period of time than we could. Our technologies and products may be rendered obsolete or uneconomical by technological advances or entirely different approaches developed by one or more of our competitors. As more companies develop new intellectual property in our markets, the possibility of a competitor acquiring patent or other rights that may limit our products or potential products increases, which could lead to litigation.
Operations
Our corporate headquarters is located in Redwood City, California and provides general administrative support to our business and is the center of our manufacturing and research and development operations. In 2008, we established our facilities in Budapest, Hungary to create a research and development center for microbial biocatalyst improvement and fermentation development and to reduce our research and development costs. As of December 31, 2013, we employed 125 people worldwide, with 91 of our employees located in Redwood City. Please see Note 16 to our consolidated financial statements appearing in Item 8 of this Annual Report on Form 10-K for a description of our revenue and long-lived assets both within and outside of the United States.
Our research and development operations include efforts directed towards biocatalyst evolution, bioprocess development, cellular engineering, biocatalyst screening, metabolites, strain improvement, fermentation development and process engineering. We conduct enzyme evolution, enzyme production development, microbial bioprocess development, cellular engineering, microbial evolution and process engineering evaluations and design primarily at our headquarters in Redwood City.
We have limited internal manufacturing capacity at our headquarters in Redwood City. We expect to rely on third-party manufacturers for commercial production of our biocatalysts for the foreseeable future. Our in-house manufacturing is dedicated to producing both Codex® Biocatalyst Panels and Kits and enzymes for use by our customers in pilot scale production. We also supply initial commercial quantities of biocatalysts for use by our collaborators to produce pharmaceutical intermediates and manufacture biocatalysts that we sell.
We rely on a contract manufacturer, Lactosan GmbH & Co. KG ("Lactosan") to manufacture substantially all of the commercial enzymes used in our pharmaceutical business. We have qualified other contract manufacturers to manufacture biocatalysts for our pharmaceutical business, but we do not currently rely on them for any of our supply requirements. We also work with suppliers in Austria, Germany and India.
We intend to rely on contract manufacturers for the production of the biocatalysts used in our fine chemicals business.
Customers
We rely on a limited number of customers for the majority of our revenues. For the years ended December 31, 2013, 2012 and 2011, our top five customers accounted for 81%, 83% and 77% of our total revenues, respectively. Customers with revenues of 10% or more of our total revenues in any of the past three fiscal years consist of the following:
13
|
Percentage of Total Revenues
For The Years Ended December 31,
|
||||||||
2013 |
2012 |
2011 |
||||||
Customers: |
||||||||
Merck |
39 |
% |
13 |
% |
10 |
% |
||
Exela |
15 |
% |
— |
% |
— |
% |
||
Novartis |
14 |
% |
1 |
% |
1 |
% |
||
Shell (1) |
— |
% |
51 |
% |
51 |
% |
||
(1) Our research agreement with Shell terminated effective August 31, 2012 and we will not receive any additional collaboration funding from Shell.
Backlog
We accept purchase orders for deliveries covering periods from one day up to approximately one year from the date on which the order is placed. However, purchase orders can generally be revised or cancelled by the customer without penalty. In addition, significant portions of our sales are ordered with relatively short lead times. Considering these industry practices and our experience, we do not believe the total of customer purchase orders outstanding (backlog) provides meaningful information that can be relied on to predict actual sales for future periods.
Employees
As of December 31, 2013, we had 125 employees worldwide. Of these employees, 82 were engaged in research and development, 16 were engaged in manufacturing and operations, and 27 were engaged in general and administrative activities, respectively. None of our employees are represented by a labor union, and we consider our employee relations to be good.
Corporate and Available Information
Our principal corporate offices are located at 200 Penobscot Drive, Redwood City, California 94063 and our telephone number is (650) 421-8100. We were incorporated in Delaware in January 2002. Our internet address is www.codexis.com. We make available on our website, free of charge, our Annual Report on Form 10-K, Quarterly Reports on Form 10-Q, Current Reports on Form 8-K and any amendments to those reports, as soon as reasonably practicable after we electronically file such materials with, or furnish it to, the Securities Exchange Commission, or the SEC. Our SEC reports can be accessed through the Investor Relations section of our internet website. The information found on our internet website is not part of this or any other report we file with or furnish to the SEC.
ITEM 1A. RISK FACTORS
You should carefully consider the risks described below together with the other information set forth in this Annual Report on Form 10-K, which could materially affect our business, financial condition or future results. The risks described below are not the only risks facing our company. Risks and uncertainties not currently known to us or that we currently deem to be immaterial also may materially adversely affect our business, financial condition and/or operating results.
Risks Relating to Our Business and Strategy
We have a limited operating history and have recently experienced significant changes to our business, which may make it difficult to evaluate our current business and predict our future performance.
Our company has been in existence since January 2002. From 2002 until 2005, our operations focused on organizing and staffing our company and developing our technology platform. In 2005, we recognized our first revenues from product sales. Since 2005, we have continued to generate revenues, but because our revenue growth has occurred in recent periods, our limited operating history may make it difficult to evaluate our current business and predict our future performance. Additionally, from 2006 to August 2012, a major portion of our business revolved around our research and development collaboration with Shell with respect to advanced biofuels, and the collaboration accounted for 0%, 51% and 51% of our revenues in 2013, 2012 and 2011, respectively. Upon the termination of the Shell collaboration in August 2012, we undertook a significant restructuring of our operations as a result and refocused our business on the biocatalysis market. In November 2013, we announced that we had immediately begun to wind down our CodeXyme® cellulase enzymes program, and that we had stopped further development of our CodeXol® detergent alcohols program in the third quarter of 2013. As a result of these changes in our business and any changes to our business focus that we may make as we move forward, our operating history in
14
past periods may not provide much of a basis to evaluate our current business or predict our future performance. Any assessments of our current business and predictions you make about our future success or viability may not be as accurate as they could be if we had a longer operating history or if we had not experienced significant changes to our business. We have encountered and will continue to encounter risks and difficulties frequently experienced by young companies in rapidly changing industries. If we do not address these risks successfully, our business will be harmed.
Our quarterly or annual operating results may fluctuate in the future. As a result, we may fail to meet or exceed the expectations of research analysts or investors, which could cause our stock price to decline.
Our financial condition and operating results have varied significantly in the past and may continue to fluctuate from quarter to quarter and year to year in the future due to a variety of factors, many of which are beyond our control. Factors relating to our business that may contribute to these fluctuations include the following factors, as well as other factors described elsewhere in this report:
• |
our ability to achieve or maintain profitability; |
• |
our ability to obtain substantial additional capital that may be necessary to expand our business; |
• |
our dependence on a limited number of customers; |
• |
our ability to develop and successfully commercialize new products for the biocatalysis market(s); |
• |
charges to earnings as a result of any impairment of goodwill, intangible assets or other long-lived assets; |
• |
our ability to realize the expected benefits from the corporate restructuring we undertook in November 2013; |
• |
our customers' ability to timely pay amounts owed to us; |
• |
our dependence on a limited number of products in our pharmaceutical business; |
• |
our ability to maintain internal control over financial reporting; |
• |
our reliance on one contract manufacturer for commercial scale production of substantially all of our enzymes; |
• |
our relationships with, and dependence on, collaborators in our principal markets; |
• |
our ability to deploy our technology platform in the fine chemicals markets; |
• |
our dependence on, and the need to attract and retain key management and other personnel; |
• |
the success of our customers' pharmaceutical products in the market and the ability of such customers to obtain regulatory approvals for products and processes; |
• |
our ability to control and to improve pharmaceutical product gross margins; |
• |
our exposure to potential third party claims resulting from Dyadic's proper termination of our license rights for Dyadic's commercial scale expression systems for cellulases; |
• |
risks associated with the international aspects of our business; |
• |
our ability to integrate any businesses we may acquire with our business; |
• |
our ability to accurately report our financial results in a timely manner; |
• |
our ability to obtain, protect and enforce our intellectual property rights; |
• |
our ability to prevent the theft or misappropriation of our biocatalysts, the genes that code for our biocatalysts, know-how or technologies; |
• |
potential advantages that our competitors and potential competitors may have in securing funding or developing products; |
• |
business interruptions, such as earthquakes and other natural disasters; |
• |
public concerns about the ethical, legal and social ramifications of genetically engineered products and processes; |
• |
our ability to comply with laws and regulations; |
• |
our ability to properly handle and dispose of hazardous materials used in our business; |
• |
potential product liability claims; and |
• |
our ability to use our net operating loss carryforwards to offset future taxable income. |
Due to the various factors mentioned above, and others, the results of any prior quarterly or annual periods should not be relied upon as indications of our future operating performance.
We have a history of net losses and we may not achieve or maintain profitability.
We have incurred net losses since our inception, including losses of $16.6 million, $30.9 million and $41.3 million in 2011, 2012 and 2013, respectively. As of December 31, 2013, we had an accumulated deficit of $256.9 million. Until September 2012, we derived a substantial portion of our revenues from research and development agreements with our collaborators, particularly Shell, who accounted for 0%, 51% and 51% of our revenues in 2013, 2012 and 2011, respectively. Our research and development collaboration with Shell terminated effective as of August 31, 2012, and we do not expect to receive further collaboration revenue from Shell. In November 2013, we announced that we had immediately begun to wind down our CodeXyme® cellulase enzymes program, and that we had stopped further development of our CodeXol® detergent alcohols program in the third quarter of 2013. If we are unable to expand our biocatalysis business, through new or expanded
15
collaborations, development of new products or services, or increased sales of existing products and services, our net losses may increase and we may never achieve profitability. In addition, some of our collaboration agreements provide for milestone payments and/or future royalty payments, which we will only receive if we and our collaborators develop and commercialize products. We also may fund development of additional biocatalysis products. There can be no assurance that any of these products will become commercially viable or that we will ever achieve profitability on a quarterly or annual basis. If we fail to achieve profitability, or if the time required to achieve profitability is longer than we anticipate, we may not be able to continue our business. Even if we do achieve profitability, we may not be able to sustain or increase profitability on a quarterly or annual basis.
We may need substantial additional capital in the future in order to expand our business.
Our future capital requirements may be substantial, particularly as we continue to develop our business. Although we believe that, based on our current level of operations, our existing cash, cash equivalents and marketable securities will provide adequate funds for ongoing operations, planned capital expenditures and working capital requirements for at least the next 12 months, we may need additional capital if our current plans and assumptions change. Our need for additional capital will depend on many factors, including the financial success of our biocatalysis business, our spending to develop and commercialize new and existing products and the amount of collaboration funding we may receive to help cover the cost of such expenditures, the effect of any acquisitions of other businesses, technologies or facilities that we may make or develop in the future, our spending on new market opportunities, including opportunities in the fine chemicals markets, and the filing, prosecution, enforcement and defense of patent claims. If our capital resources are insufficient to meet our capital requirements, and we are unable to enter into or maintain collaborations with partners that are able or willing to fund our development efforts or commercialize any products that we develop or enable, we will have to raise additional funds to continue the development of our technology and products and complete the commercialization of products, if any, resulting from our technologies. If future financings involve the issuance of equity securities, our existing stockholders would suffer dilution. If we raise debt financing, we may be subject to restrictive covenants that limit our ability to conduct our business. We may not be able to raise sufficient additional funds on terms that are favorable to us, if at all. If we fail to raise sufficient funds and fail to generate sufficient revenues to achieve planned gross margins and to control operating costs, our ability to fund our operations, take advantage of strategic opportunities, develop products or technologies, or otherwise respond to competitive pressures could be significantly limited. If this happens, we may be forced to delay or terminate research or development programs or the commercialization of products resulting from our technologies, curtail or cease operations or obtain funds through collaborative and licensing arrangements that may require us to relinquish commercial rights, or grant licenses on terms that are not favorable to us. If adequate funds are not available, we will not be able to successfully execute our business plan or continue our business.
We are dependent on a limited number of customers.
Our current revenues are derived from a limited number of key customers. For the year ended December 31, 2012, our top five customers accounted for 83% of our total revenues, with Shell accounting for 51% of our total revenues. For the year ended December 31, 2013, our top five customers accounted for 81% of our total revenues. Our research collaboration with Shell terminated effective as of August 31, 2012, which means that we will not receive any additional collaboration funding from Shell. We expect a limited number of customers to continue to account for a significant portion of our revenues for the foreseeable future. This customer concentration increases the risk of quarterly fluctuations in our revenues and operating results. The loss or reduction of business from one or a combination of our significant customers could, materially adversely affect our revenues, financial condition and results of operations.
If we are unable to develop and commercialize new products for the pharmaceutical and fine chemicals markets, our business and prospects will be harmed.
We plan to launch new products for the pharmaceutical and fine chemicals markets. These efforts are subject to numerous risks, including the following:
• |
pharmaceutical and fine chemicals companies may be reluctant to adopt new manufacturing processes that use our enzymes; |
• |
we may be unable to successfully develop the enzymes or manufacturing processes for our products in a timely and cost-effective manner, if at all; |
• |
we may face difficulties in transferring the developed technologies to our customers and the contract manufacturers that we may use for commercial scale production of intermediates and enzymes in these markets; |
• |
the contract manufacturers that we may use may be unable to scale their manufacturing operations to meet the demand for these products and we may be unable to secure additional manufacturing capacity; |
• |
customers may not be willing to purchase these products for these markets from us on favorable terms, if at all; |
• |
we may face product liability litigation, unexpected safety or efficacy concerns and product recalls or withdrawals; |
16
• |
changes in laws or regulations relating to the pharmaceutical industry or the industries into which we sell our fine chemicals products, including the food industry, could cause us to incur increased costs of compliance or otherwise harm our business; |
• |
our customers' products may experience adverse events or face competition from new products, which would reduce demand for our products; |
• |
we may face pressure from existing or new competitive products; and |
• |
we may face pricing pressures from existing or new competitors, some of which may benefit from government subsidies or other incentives. |
If goodwill or our intangible or other long-lived assets become impaired we may be required to record a significant charge to earnings.
Our total assets reflect goodwill of $3.2 million, intangible assets of $9.6 million and other long-lived assets of $8.8 million as of December 31, 2013. Under accounting principles generally accepted in the United States, or GAAP, we review goodwill for impairment on at least an annual basis and at any interim date whenever events or changes in circumstances indicate that the carrying value may not be recoverable. We review our long lived and intangible assets with finite lives for impairment whenever events or changes in circumstances indicate that the carrying amount of the assets may not be recoverable. Events or changes in circumstances (i.e., information that indicates an impairment might exist), could include: a significant decrease in the market price of the Company's common stock; current period cash flow losses or operating losses combined with a history of losses or a forecast of continuing losses associated with the use of the assets; slower growth rates in our industry; significant adverse changes in the business climate or legal factors; accumulation of costs significantly in excess of the amount originally expected for the acquisition or construction of the assets; loss of significant customers or partners; or the current expectation that the assets will more likely than not be sold or disposed of significantly before the end of their estimated useful life. For example, as described in Note 2 to the consolidated financial statements appearing in Item 8 of this Annual Report on Form 10-K, as of December 31, 2013, we determined that continued operating losses and a decline in market price of the Company’s common stock were indicators of impairment. Consequently, we tested long-lived assets and intangible assets for impairment as of December 31, 2013. Based on our analysis, we determined that the fair value of the assets exceeded their carrying value and that no impairment was necessary as of December 31, 2013. Nevertheless, we may experience additional events or changes in circumstances in the future that we determine to be indicators of impairment, and that may in turn require us to undertake impairment analysis in future periods. Depending on the circumstances and judgments made at such future time, the outcome of the analysis may require us to recognize impairment.
We may be required to record a significant charge to earnings in our financial statements during the period in which any impairment of our goodwill, intangible assets or other long-lived assets is determined, resulting in an adverse impact on our financial position and results of operations.
We implemented cost saving measures in the fourth quarter of 2013, and we may implement additional cost saving measures in the future. These measures may interfere with the operation of our business and if we are unable to realize the anticipated benefits of these measures, our operating results and financial condition could be adversely affected.
In November 2013, we announced a restructuring plan that includes a reduction of approximately 15 employees in the United States. If we are unable to realize the expected operational efficiencies and financial benefits from this reduction and restructuring activity, our operating results and financial condition would be adversely affected. Restructuring costs include exit-related costs arising from contractual and other obligations. We continue to review our cost structure and may implement further cost saving initiatives in the future. This cost reduction effort may interfere with our ability to achieve our business objectives, may be difficult to manage, may cause concerns from current and potential customers, suppliers and other third parties with whom we do business and may increase the likelihood of turnover of other key employees, all of which may have an adverse impact on our business.
Our revenues, financial condition and results of operations may also be adversely affected if one or more of our customers is delayed in paying, or becomes unable to pay, for our delivered products on a timely basis.
Certain of our customers are, or in the future may become, subject to significant economic and other challenges that affect their cash flow, and many customers outside of the United States are generally accustomed to vendor financing in the form of extended payment terms which may exceed contractual payment terms. To remain competitive in markets outside of the United States, we may offer selected customers payment flexibility. We consider arrangements with extended payment terms not to be fixed or determinable, and accordingly, we defer revenue until payment is received. The costs associated with such revenue deferral are also deferred and classified as other current assets in the financial statements. If these customers fail to pay us on a timely basis it may cause our financial results to fluctuate and we may decide to grant concessions to such
17
customers to increase the probability of payment. Such concessions, or failure by such customers to pay at all, would adversely impact our financial condition and results of operations.
We are dependent on a limited number of products in our pharmaceutical business.
Our current product revenues are derived from a limited number of pharmaceutical products. We expect a limited number of pharmaceutical products to continue to account for a significant portion of our pharmaceutical product revenues for the foreseeable future. This product concentration increases the risk of quarterly fluctuations in our revenues and operating results. The loss or reduction of business of one or a combination of our significant pharmaceutical products could materially adversely affect our revenues, financial condition and results of operations. For instance, product revenues for the year ended December 31, 2013 was $20.4 million, a decrease from $35.9 million in product revenues for the year ended December 31, 2012, and $49.0 million in product revenues for the year ended December 31, 2011, primarily due to lower revenues for generic statin-family products. These products were approximately $2.7 million in product revenues for the year ended December 31, 2013, as compared to $20.9 million and $30.0 million, for the years ended December 31, 2012 and 2011, respectively.
If we are unable to implement and maintain effective internal control over financial reporting in the future, the accuracy and timeliness of our financial reporting may be adversely affected.
Section 404 of the Sarbanes-Oxley Act of 2002 requires companies to conduct a comprehensive evaluation of their disclosure controls and procedures over financial reporting. At the end of each fiscal year, we must perform an evaluation of our disclosure controls and procedures over financial reporting, include in our annual report the results of the evaluation, and have our external auditors publicly attest to such evaluation.
In connection with the integrated audit of our consolidated financial statements and internal control over financial reporting and management's assessment of our internal controls over financial reporting at December 31, 2012, a material weakness in our internal control over financial reporting was identified. The material weakness we and our independent registered public accounting firm identified related to the lack of a sufficient number of qualified personnel to timely and appropriately account for complex, non-routine transactions in accordance with United States generally accepted accounting principles. We implemented policies and procedures to remediate this deficiency and based on the procedures performed as of December 31, 2013, we noted no control deficiencies that would arise to a material weakness in our internal control over financial reporting.
We have taken numerous steps to enhance our internal control over financial reporting, including the development and implementation of policies, improved processes and documented procedures, the retention of third-party experts and contractors, and the hiring of additional accounting and finance personnel with technical accounting, inventory accounting and financial reporting experience. We cannot assure you that in the future material weaknesses or significant deficiencies will not exist or otherwise be discovered, a risk that is significantly increased in light of the complexity of our business and multinational operations. If other deficiencies are discovered in the future, our ability to accurately and timely report our financial position, results of operations or cash flows could be impaired, which could result in late filings of our annual and quarterly reports under the Securities Exchange Act of 1934, as amended, restatements of our consolidated financial statements, a decline in our stock price, suspension or delisting of our common stock by The NASDAQ Global Market, or other material adverse effects on our business, reputation, results of operations, financial condition or liquidity.
We are dependent on contract manufacturers for commercial scale production of substantially all of our enzymes.
We have limited internal capacity to manufacture enzymes. As a result, we are dependent upon the performance and capacity of third party manufacturers for the commercial scale manufacturing of the enzymes used in our pharmaceutical and fine chemicals business.
We rely on one contract manufacturer, Lactosan, for our pharmaceutical business to manufacture substantially all of the commercial enzymes used in our pharmaceutical and fine chemicals businesses. These businesses, therefore, face risks of difficulties with, and interruptions in, performance by Lactosan, the occurrence of which could adversely impact the availability, launch and/or sales of our enzymes in the future. We have qualified other contract manufacturers to manufacture enzymes for our pharmaceutical business, but currently have limited reliance on them for our supply requirements. The failure of any contract manufacturers that we may use to supply manufactured enzymes on a timely basis or at all, or to manufacture our enzymes in compliance with our specifications or applicable quality requirements or in volumes sufficient to meet demand would adversely affect our ability to sell pharmaceutical and fine and complex chemicals products, could harm our relationships with our collaborators or customers and could negatively affect our revenues and operating results. We may be forced to secure alternative sources of supply, which may be unavailable on commercially acceptable terms, cause delays in our ability to deliver products to our customers, increase our costs and decrease our profit margins.
18
We do not have any supply agreements in place with any enzyme contract manufacturers, other than Lactosan. In the absence of a supply agreement, a contract manufacturer will be under no obligation to manufacture our enzymes and could elect to discontinue their manufacture at any time. If we require additional manufacturing capacity and are unable to obtain it in sufficient quantity, we may not be able to increase our pharmaceutical and fine and complex chemicals sales, or we may be required to make substantial capital investments to build that capacity or to contract with other manufacturers on terms that may be less favorable than the terms we currently have with our suppliers. If we choose to build our own additional manufacturing facility, it could take two years or longer before our facility is able to produce commercial volumes of our enzymes. Any resources we expend on acquiring or building internal manufacturing capabilities could be at the expense of other potentially more profitable opportunities. In addition, if we contract with other manufacturers, we may experience delays of several months in qualifying them, which could harm our relationships with our collaborators or customers and could negatively affect our revenues or operating results.
We are dependent on our collaborators, and our failure to successfully manage these relationships could prevent us from developing and commercializing many of our products and achieving or sustaining profitability, and could lead to disagreements with our current or former collaborators.
Our ability to maintain and manage collaborations in our markets is fundamental to the success of our business. We currently have license agreements, research and development agreements, supply agreements and/or distribution agreements with various collaborators. We may have limited or no control over the amount or timing of resources that any collaborator is able or willing to devote to our partnered products or collaborative efforts. Any of our collaborators may fail to perform its obligations. These collaborators may breach or terminate their agreements with us or otherwise fail to conduct their collaborative activities successfully and in a timely manner. Further, our collaborators may not develop products arising out of our collaborative arrangements or devote sufficient resources to the development, manufacture, marketing, or sale of these products. Moreover, disagreements with a collaborator could develop and any conflict with a collaborator lead to litigation and could reduce our ability to enter into future collaboration agreements and negatively impact our relationships with one or more existing collaborators. If any of these events occur, or if we fail to maintain our agreements with our collaborators, we may not be able to commercialize our existing and potential products, grow our business, or generate sufficient revenues to support our operations, and we may be involved in litigation. Our collaboration opportunities could be harmed if:
• |
we do not achieve our research and development objectives under our collaboration agreements in a timely manner or at all; |
• |
we develop products and processes or enter into additional collaborations that conflict with the business objectives of our other collaborators; |
• |
our collaborators and/or our contract manufacturers do not receive the required regulatory and other approvals necessary for the commercialization of the applicable product; |
• |
we disagree with our collaborators as to rights to intellectual property that are developed during the collaboration, or their research programs or commercialization activities; |
• |
we are unable to manage multiple simultaneous collaborations; |
• |
our collaborators become competitors of ours or enter into agreements with our competitors; |
• |
our collaborators become unable or less willing to expend their resources on research and development or commercialization efforts due to general market conditions, their financial condition or other circumstances beyond our control; or |
• |
our collaborators experience business difficulties, which could eliminate or impair their ability to effectively perform under our agreements. |
Additionally, despite the termination of the research term of our three-way research collaboration with Shell and Iogen, many elements of our collaborative research and license agreement with Shell and Iogen will continue. For example, the collaborative research and license agreement provides for certain rights, licenses and obligations of each party with respect to intellectual property and program materials that will continue after the research activities have ended. Disagreements or conflicts between and among the parties could develop even though the research program has ended. These disagreements or conflicts could result in expensive arbitration or litigation, which may not be resolved in our favor.
Finally, our business could be negatively affected if any of our collaborators or suppliers undergo a change of control or were to otherwise assign the rights or obligations under any of our agreements.
Our efforts to deploy our technology platform in the fine chemicals markets, may fail.
We have recently begun to use our CodeEvolver® directed evolution technology platform to develop new products in the fine chemicals markets. We do not know if we can successfully compete in this new market. This new market is well established and consists of numerous large, well-funded entrenched market participants who have long and established track records and customer relationships. We have currently developed products in the food and solvent sectors of this market, and these
19
products, or any other products that we may develop in the future for the fine chemicals market, we may not succeed in displacing current products. If we succeed in commercializing new products for the fine chemicals market, we may not generate significant revenue and cash flows from these activities. The failure to successfully deploy products in the fine chemicals space may limit our growth and have a material adverse effect on our financial condition, operating results and business prospects.
If we lose key personnel, including key management personnel, or are unable to attract and retain additional personnel as needed in the future, it could disrupt the operation of our business, delay our product development programs, harm our research and development efforts, and we may be unable to pursue collaborations or develop our own products.
Our business involves complex, global operations across a variety of markets and requires a management team and employee workforce that is knowledgeable in the many areas in which we operate. The loss of any key members of our management team or the failure to attract or retain other key employees who possess the requisite expertise for the conduct of our business could prevent us from developing and commercializing our products for our target markets and entering into collaborations or licensing arrangements to execute on our business strategy.
In addition, the loss of any key scientific staff, or the failure to attract or retain other key scientific employees, could prevent us from developing and commercializing our products for our target markets and entering into collaborations or licensing arrangements to execute on our business strategy. We may not be able to attract or retain qualified employees in the future due to the intense competition for qualified personnel among biotechnology and other technology-based businesses or due to the availability of personnel with the qualifications or experience necessary for our business. Additionally, potential future government awards may require us to maintain a minimum level of staffing. If we are not able to attract and retain the necessary personnel to accomplish our business objectives, we may experience staffing constraints that will adversely affect our ability to meet the demands of our collaborators and customers in a timely fashion or to support our internal research and development programs. In particular, our product and process development programs are dependent on our ability to attract and retain highly skilled scientists and engineers. Competition for experienced scientists and other technical personnel from numerous companies and academic and other research institutions may limit our ability to do so on acceptable terms. All of our employees are at-will employees, which mean that either the employee or we may terminate their employment at any time.
Our planned activities will require additional expertise in specific industries and areas applicable to the products and processes developed through our technology platform or acquired through strategic or other transactions, especially in the end markets that we seek to penetrate. These activities will require the addition of new personnel, and the development of additional expertise by existing personnel. The inability to attract personnel with appropriate skills or to develop the necessary expertise could impair our ability to grow our business.
In August and September 2012, we implemented a corporate restructuring plan that included a reduction in work force of approximately 55% of our total workforce and the closure of our Singapore facility. We also announced a workforce reduction on November 12, 2013, which includes the termination of approximately 12% of our total workforce. Our restructuring activities and the workforce reductions have had and may continue to have a negative effect on employee morale, and we may have difficulty in attracting and retaining qualified personnel.
Our business could be adversely affected if our customers' products are not received well in the market, if their products, or the processes used by our customers to manufacture their final products, fail to be approved, or if our customers discontinue their drug development activities for any reason.
Our enzymes are used by our pharmaceutical customers in the manufacture of intermediates and APIs which are then used in the manufacture of final pharmaceutical products by our existing and potential branded drug customers, and by our fine chemicals customers to manufacture food ingredients. Our business could be adversely affected if these final products do not perform in the market as well as expected, or if our customers encounter competition from new entrants into the market with competing, and possibly superior, products. Additionally, these pharmaceutical and food products must be approved by the FDA in the United States and similar regulatory bodies in other markets prior to commercialization. If our customers who sell branded-drugs, which we refer to as innovators, fail to receive regulatory approval for the drugs, fail to receive regulatory approval for new manufacturing processes for previously approved drugs, or decide for business or other reasons to discontinue their drug development activities, our revenues and prospects will be negatively impacted. The process of producing these drugs, and their generic equivalents, is also subject to regulation by the FDA in the United States and equivalent regulatory bodies in other markets. Similarly, if the market-leading food ingredients company that we have recently begun performing services for is unable to receive regulatory approval for its product, or decides to discontinue developing its product using our technology, our revenues and prospects will be negatively impacted. If any pharmaceutical or food manufacturing process that uses our enzymes or enzyme technology does not receive approval by the appropriate regulatory body or if customers decide not to pursue approval, our business could be adversely affected.
20
Our pharmaceutical product gross margins are variable and may decline from quarter to quarter.
Our pharmaceutical product gross margins have varied significantly in the past and may continue to fluctuate from quarter to quarter and year to year in the future due to a variety of factors, including product mix, pricing pressure from our pharmaceutical customers and competition from other products or technologies. This variability may have a material adverse impact on our operating results and financial condition and cause our stock price to decline.
We may be exposed to third party legal claims if Dyadic terminates our license rights to Dyadic’s commercial scale expression system for the production of enzymes.
We entered into the Dyadic license agreement in November 2008 to obtain a non-exclusive license to Dyadic's C-1 based proprietary fungal expression technology for the production of enzymes. We are licensed to use these enzymes to make products in the fields of biofuels, certain pharmaceuticals, chemicals, air treatment, water treatment and the conversion of cellulosic biomass into fermentable sugars for use in non-fuel products. We also obtained access to specified materials of Dyadic relating to such Dyadic technology. We used the licensed technology in connection with our CodeXyme® cellulase enzyme program which we announced on November 12, 2013 we were immediately beginning to wind down. Our license is sublicenseable to Shell and to affiliates of Shell in the field of biofuels, and sublicenseable to third parties in the non-biofuels fields of certain pharmaceuticals, chemicals, air treatment, water treatment and the conversion of cellulosic biomass into fermentable sugars for non-fuel products. Dyadic has the right to terminate our licenses under the license agreement if we challenge the validity of any of the patents licensed under the Dyadic license agreement and for various other reasons, including by reason of an uncured material breach by Codexis. Our licenses and access to such materials of Dyadic under the Dyadic license agreement will terminate as a result of any proper termination of the Dyadic license agreement other than due to Dyadic's material breach. Our sublicense to Shell under the Dyadic license agreement will also terminate if the Dyadic license agreement is properly terminated other than due to Dyadic's material breach. Any termination of our licenses under the Dyadic license agreement may result in potential litigation with third parties that we have sublicensed these license rights to. Any such termination could also adversely affect our ability to enter into a strategic transaction involving our CodeXyme® cellulase enzymes program.
On July 30, 2013, Dyadic delivered notice to us alleging that we were in breach under the Dyadic license agreement and stating that Dyadic intended to terminate the Dyadic license agreement in 60 days if the alleged breach was not cured to Dyadic's satisfaction. This notice was subsequently withdrawn by Dyadic in March 2014 in light of our decision to wind down our CodeXyme® cellulase enzyme program. In connection with the withdrawal, we agreed with Dyadic that such withdrawal does not constitute (1) a waiver or impairment of Dyadic’s ability to assert any rights, remedies or claims that Dyadic has or will have in the future against us under the Dyadic License Agreement; (2) a waiver of any defenses to any claims we may assert now or in the future; (3) a concession that any claim, remedy or defense Dyadic may have lacks merit; or (4) an acknowledgment that we have cured any aspect of the alleged breach. Although we do not believe that the use of the licensed technology in our CodeXyme® cellulase enzyme program constituted a breach of the Dyadic license agreement , we can make no assurances that Dyadic will not make such allegations again in the future, or regarding our ability to resolve any possible future disputes with Dyadic on commercially reasonable terms or our ability to dispute with success, through legal action or otherwise, any possible future allegations by Dyadic that such use may have breached the Dyadic license agreement.
We may be unable to realize a favorable strategic transaction for our former CodeXyme® cellulase enzymes and CodeXol® detergent alcohols programs.
In November 2013 we announced that we were winding down our CodeXyme® cellulase enzymes program, and that we had stopped development of our CodeXol® detergent alcohols program. Although we continue to explore possible strategic transactions with respect to those programs and their related assets, we may be unable to effect any such strategic transactions on favorable terms, if it all, which could have an adverse effect on our results of operations and financial condition.
We face risks associated with our international business.
Significant portions of our operations are conducted outside of the United States and we expect to continue to have significant foreign operations in the foreseeable future. International business operations are subject to a variety of risks, including:
• |
changes in or interpretations of foreign regulations that may adversely affect our ability to sell our products, repatriate profits to the United States or operate our foreign-located facilities; |
• |
the imposition of tariffs; |
• |
the imposition of limitations on, or increase of, withholding and other taxes on remittances and other payments by foreign subsidiaries or joint ventures; |
21
• |
the imposition of limitations on genetically-engineered products or processes and the production or sale of those products or processes in foreign countries; |
• |
currency exchange rate fluctuations; |
• |
uncertainties relating to foreign laws, regulations and legal proceedings including tax, import/export, anti-corruption and exchange control laws; |
• |
the availability of government subsidies or other incentives that benefit competitors in their local markets that are not available to us; |
• |
increased demands on our limited resources created by our diversified, global operations may constrain the capabilities of our administrative and operational resources and restrict our ability to attract, train, manage and retain qualified management, technicians, scientists and other personnel; |
• |
economic or political instability in foreign countries; |
• |
difficulties associated with staffing and managing foreign operations; and |
• |
the need to comply with a variety of United States and foreign laws applicable to the conduct of international business, including import and export control laws and anti-corruption laws. |
If we engage in any acquisitions, we will incur a variety of costs and may potentially face numerous risks that could adversely affect our business and operations.
We have made acquisitions in the past, and if appropriate opportunities become available, we expect to acquire additional businesses, assets, technologies, or products to enhance our business in the future. For example, in October 2010, we acquired substantially all of the patents and other intellectual property rights associated with Maxygen's directed evolution technology.
In connection with any future acquisitions, we could:
• |
issue additional equity securities, which would dilute our current stockholders; |
• |
incur substantial debt to fund the acquisitions; |
• |
use our cash to fund the acquisitions; or |
• |
assume significant liabilities including litigation risk. |
Acquisitions involve numerous risks, including problems integrating the purchased operations, technologies or products, unanticipated costs and other liabilities, diversion of management's attention from our core businesses, adverse effects on existing business relationships with current and/or prospective collaborators, customers and/or suppliers, risks associated with entering markets in which we have no or limited prior experience and potential loss of key employees. We do not have extensive experience in managing the integration process and we may not be able to successfully integrate any businesses, assets, products, technologies, or personnel that we might acquire in the future without a significant expenditure of operating, financial and management resources, if at all. The integration process could divert management's time from focusing on operating our business, result in a decline in employee morale and cause retention issues to arise from changes in compensation, reporting relationships, future prospects or the direction of the business. Acquisitions may also require us to record goodwill and non-amortizable intangible assets that will be subject to impairment testing on a regular basis and potential periodic impairment charges, incur amortization expenses related to certain intangible assets, and incur large and immediate write offs and restructuring and other related expenses, all of which could harm our operating results and financial condition. In addition, we may acquire companies that have insufficient internal financial controls, which could impair our ability to integrate the acquired company and adversely impact our financial reporting. If we fail in our integration efforts with respect to any of our acquisitions and are unable to efficiently operate as a combined organization, our business and financial condition may be adversely affected.
We must rely on our suppliers, contract manufacturers and customers to deliver timely and accurate information in order to accurately report our financial results in the time frame and manner required by law.
We need to receive timely, accurate and complete information from a number of third parties in order to accurately report our financial results on a timely basis. We rely on suppliers and certain contract manufacturers to provide us with timely and accurate information regarding our inventories and manufacturing cost information, and we rely on current and former collaborators to provide us with product sales and cost saving information in connection with royalties owed to us. Any failure to receive timely information from one or more of these third parties could require that we estimate a greater portion of our revenues and other operating performance metrics for the period, which could cause our reported financial results to be incorrect. Moreover, if the information that we receive is not accurate, our financial statements may be materially incorrect and may require restatement, and we may not receive the full amount of revenues that we are entitled to under these arrangements. Although we typically have audit rights with these parties, performing such an audit could be harmful to our collaborative relationships, expensive and time consuming and may not be sufficient to reveal any discrepancies in a timeframe consistent with our reporting requirements.
22
Our ability to compete may decline if we do not adequately protect our proprietary technologies or if we lose some of our intellectual property rights.
Our success depends in part on our ability to obtain patents and maintain adequate protection of our intellectual property for our technologies and products and potential products in the United States and other countries. We have adopted a strategy of seeking patent protection in the United States and in foreign countries with respect to certain of the technologies used in or relating to our products and processes. As such, as of December 31, 2013, we owned or controlled approximately 394 issued patents and approximately 301 pending patent applications in the United States and in various foreign jurisdictions. Some of our gene shuffling patents will expire as early as 2014. We also have license rights to a number of issued patents and pending patent applications in the United States and in various foreign jurisdictions. Our owned and licensed patents and patent applications are directed to our enabling technologies and to the methods and products that support our business in the pharmaceuticals manufacturing and complex chemistry markets. We intend to continue to apply for patents relating to our technologies, methods and products as we deem appropriate.
Numerous patents in our portfolio involve complex legal and factual questions and, therefore, enforceability cannot be predicted with any certainty. Issued patents and patents issuing from pending applications may be challenged, invalidated, or circumvented. Moreover, the United States Leahy-Smith America Invents Act, enacted in September 2011, brings significant changes to the United States patent system, which include a change to a “first to file” system from a “first to invent” system and changes to the procedures for challenging issued patents and disputing patent applications during the examination process, among other things. The effects of these changes on our patent portfolio and business are currently uncertain as the United Stated Patent and Trademark Office has just implemented regulations related to these changes and the courts have yet to address many of these provisions in the context of a dispute. We have not assessed the applicability of the act and new regulations on our patent portfolio. These changes could increase the costs and uncertainties surrounding the prosecution of our patent applications and the enforcement or defense of our patent rights. Additional uncertainty may result from legal precedent handed down by the United States Federal Circuit Court and Supreme Court as they determine legal issues concerning the scope and construction of patent claims and inconsistent interpretation of patent laws by the lower courts. Accordingly, we cannot ensure that any of our pending patent applications will result in issued patents, or even if issued, predict the breadth of the claims upheld in our and other companies' patents. Given that the degree of future protection for our proprietary rights is uncertain, we cannot ensure that: (i) we were the first to invent the inventions covered by each of our pending applications, (ii) we were the first to file patent applications for these inventions, or (iii) the proprietary technologies we develop will be patentable. In addition, unauthorized parties may attempt to copy or otherwise obtain and use our products or technology. Monitoring unauthorized use of our intellectual property is difficult, and we cannot be certain that the steps we have taken will prevent unauthorized use of our technology, particularly in certain foreign countries where the local laws may not protect our proprietary rights as fully as in the United States. Moreover, third parties could practice our inventions in territories where we do not have patent protection. Such third parties may then try to import products made using our inventions into the United States or other territories. If competitors are able to use our technology, our ability to compete effectively could be harmed. Moreover, others may independently develop and obtain patents for technologies that are similar to or superior to our technologies. If that happens, we may need to license these technologies, and we may not be able to obtain licenses on reasonable terms, if at all, which could cause harm to our business.
Third parties may claim that we are infringing their intellectual property rights or other proprietary rights, which may subject us to costly and time consuming litigation and prevent us from developing or commercializing our products.
Our commercial success also depends in part on our ability to operate without infringing patents and proprietary rights of third parties, and without breaching any licenses or other agreements that we have entered into with regard to our technologies, products and business. We cannot ensure that patents have not been issued to third parties that could block our ability to obtain patents or to operate as we would like. There may be patents in some countries that, if valid, may block our ability to make, use or sell our products in those countries, or import our products into those countries, if we are unsuccessful in circumventing or acquiring the rights to these patents. There also may be claims in patent applications filed in some countries that, if granted and valid, may also block our ability to commercialize products or processes in these countries if we are unable to circumvent or license them.
23
The industries in which we operate and the biotechnology industry in particular, are characterized by frequent and extensive litigation regarding patents and other intellectual property rights. Many biotechnology companies have employed intellectual property litigation as a way to gain a competitive advantage. Our involvement in litigation, interferences, opposition proceedings or other intellectual property proceedings inside and outside of the United States, to defend our intellectual property rights or as a result of alleged infringement of the rights of others, may divert our management's time from focusing on business operations and could cause us to spend significant amounts of money. Any potential intellectual property litigation also could force us to do one or more of the following:
• |
stop selling or using our products or technologies that use the subject intellectual property; |
• |
pay monetary damages or substantial royalties; |
• |
grant cross-licenses to third parties relating to our patents or proprietary rights; |
• |
obtain from the third party asserting its intellectual property rights a license to sell or use the relevant technology, which license may not be available on reasonable terms, or at all; or |
• |
redesign those products or processes that use any allegedly infringing technology, or relocate the operations relating to the allegedly infringing technology to another jurisdiction, which may result in significant cost or delay to us, could be technically infeasible or could prevent us from selling some of our products in the United States or other jurisdictions. |
We are aware of a significant number of patents and patent applications relating to aspects of our technologies filed by, and issued to, third parties. We cannot assure you that if this third party intellectual property is asserted against us that we would ultimately prevail.
If any of our competitors have filed patent applications or obtained patents that claim inventions also claimed by us, we may have to participate in interference proceedings before the United States Patent and Trademark Office to determine priority of invention and, thus, the right to the patents for these inventions in the United States. These proceedings could result in substantial cost to us even if the outcome is favorable. Even if successful, any interference may result in loss of certain claims. Any litigation or proceedings could divert our management's time and efforts. Even unsuccessful claims could result in significant legal fees and other expenses, diversion of management time, and disruption in our business. Uncertainties resulting from initiation and continuation of any patent or related litigation could harm our ability to compete.
We may not be able to enforce our intellectual property rights throughout the world.
The laws of some foreign countries where we do business do not protect intellectual property rights to the same extent as the laws of the United States. Many companies have encountered significant problems in protecting and defending intellectual property rights in certain foreign jurisdictions. The legal systems of certain countries, particularly certain developing countries, do not favor the enforcement of patents and other intellectual property, particularly those relating to biotechnology and/or bioindustrial technologies. Accordingly, our efforts to protect our intellectual property rights in such countries may be inadequate. This could make it difficult for us to stop the infringement of our patents or misappropriation of our other intellectual property rights. Additionally, proceedings to enforce our patent rights in foreign jurisdictions could result in substantial costs and divert our efforts and attention from other aspects of our business.
If our biocatalysts, or the genes that code for our biocatalysts, are stolen, misappropriated or reverse engineered, others could use these biocatalysts or genes to produce competing products.
Third parties, including our contract manufacturers, customers and those involved in shipping our biocatalysts, often have custody or control of our biocatalysts. If our biocatalysts, or the genes that code for our biocatalysts, were stolen, misappropriated or reverse engineered, they could be used by other parties who may be able to reproduce these biocatalysts for their own commercial gain. If this were to occur, it would be difficult for us to challenge this type of use, especially in countries with limited intellectual property protection or in countries in which we do not have patents covering the misappropriated biocatalysts.
Confidentiality agreements with employees and others may not adequately prevent disclosures of trade secrets and other proprietary information.
We rely in part on trade secret protection to protect our confidential and proprietary information and processes. However, trade secrets are difficult to protect. We have taken measures to protect our trade secrets and proprietary information, but these measures may not be effective. We require employees and consultants to execute confidentiality agreements upon the commencement of an employment or consulting arrangement with us. These agreements generally require that all confidential information developed by the individual or made known to the individual by us during the course of the individual's relationship with us be kept confidential and not disclosed to third parties. These agreements also generally provide that inventions conceived by the individual in the course of rendering services to us shall be our exclusive property. Nevertheless,
24
our proprietary information may be disclosed, third parties could reverse engineer our biocatalysts and others may independently develop substantially equivalent proprietary information and techniques or otherwise gain access to our trade secrets. Costly and time-consuming litigation could be necessary to enforce and determine the scope of our proprietary rights, and failure to obtain or maintain trade secret protection could adversely affect our competitive business position.
Competitors and potential competitors who have greater resources and experience than we do may develop products and technologies that make ours obsolete or may use their greater resources to gain market share at our expense.
The biocatalysis industry and each of our target markets are characterized by rapid technological change. Our future success will depend on our ability to maintain a competitive position with respect to technological advances. In addition, as we enter new markets, we will face new competition and will need to adapt to competitive factors that may be different from what we face today.
We are aware that other companies, including Royal DSM N.V., or DSM and Novozymes, have alternative methods for obtaining and generating genetic diversity or use mutagenesis techniques to produce genetic diversity. Academic institutions such as the California Institute of Technology, the Max Planck Institute and the Center for Fundamental and Applied Molecular Evolution (FAME), a jointly sponsored initiative between Emory University and Georgia Institute of Technology, are also working in this field. Technological development by others may result in our products and technologies, as well as products developed by our customers using our biocatalysts, becoming obsolete.
Our primary competitors in the biocatalysis market for pharmaceutical products are companies using conventional, non-enzymatic processes to manufacture pharmaceutical intermediates and APIs that compete in the marketplace with our enzymatically manufactured products. The principal methods of competition and competitive differentiation in this market are product quality and performance, including manufacturing yield and safety and environmental benefits, speed of delivery of product and price. The market for the manufacture and supply of APIs and intermediates is large with many established companies. These companies include many of our large innovator and generic pharmaceutical customers, such as Merck, Pfizer, Bristol Myers Squibb and Teva, who have significant internal research and development efforts directed at developing processes to manufacture APIs and intermediates. The processes used by these companies include classical conventional organic chemistry reactions, chemo catalysis reactions catalyzed by chemical catalysts, or biocatalytic routes using commercially available enzymes, or combinations thereof. Our manufacturing processes must compete with these internally developed routes. Additionally, we also face competition from companies such as Solvias Inc. and Takasago International Corporation who use metal-based chemical reactions for their pharmaceutical products, rather than a biocatalytic process. Finally, we face increasing competition from generic pharmaceutical manufacturers in low cost centers such as India and China.
The market for supplying enzymes for use in pharmaceutical manufacturing is quite fragmented. There is competition from large industrial enzyme companies, such as Novozymes, as well as subsidiaries of larger pharmaceutical companies, such as DSM, Cambrex Corporation and Almac Group Ltd. There is also competition in the customized and optimized enzyme area from several small European companies, such as BRAIN AG, C-LEcta GmbH and Evocatal GmbH.
We entered the fine chemicals market in 2013, namely applying our biocatalysis technology in the food and solvents markets. We face similar forms of competition in this market as in the pharmaceutical markets, with the exceptions that our fine chemicals customers do not have the in-house biocatalysis capabilities that our pharmaceutical customers have and the risk of losing out on opportunities to larger competitors in fine chemicals is greater given the larger scale of opportunities available in the fine chemicals markets compared to the pharmaceutical market. Our significant competitors in the fine chemical markets include companies that have been in these marketplaces for many years, such as Dupont-Genencor, DSM, Novozymes and A.B. Enterprises. These companies have greater resources in these markets than we do and have long-term supply arrangements already in place with customers. Our ability to compete in these markets may be limited by our relatively late start.
Our ability to compete successfully in any of these markets will depend on our ability to develop proprietary products that reach the market in a timely manner and are technologically superior to and/or are less expensive than other products on the market. Many of our competitors have substantially greater production, financial, research and development, personnel and marketing resources than we do. They also started developing products earlier than we did, which may allow them to establish blocking intellectual property positions or bring products to market before we can. In addition, certain of our competitors may also benefit from local government subsidies and other incentives that are not available to us. As a result, our competitors may be able to develop competing and/or superior technologies and processes, and compete more aggressively and sustain that competition over a longer period of time than we could. Our technologies and products may be rendered obsolete or uneconomical by technological advances or entirely different approaches developed by one or more of our competitors. We cannot be certain that any products we develop in the future will compare favorably to products offered by our competitors or that our existing or future products will compare favorably to any new products that are developed by our competitors. As more
25
companies develop new intellectual property in our markets, the possibility of a competitor acquiring patent or other rights that may limit our products or potential products increases, which could lead to litigation.
Our limited resources relative to many of our competitors may cause us to fail to anticipate or respond adequately to new developments and other competitive pressures. This failure could reduce our competitiveness and market share, adversely affect our results of operations and financial position, and prevent us from obtaining or maintaining profitability.
Business interruptions could delay us in the process of developing our products and could disrupt our sales.
Our headquarters is located in the San Francisco Bay Area near known earthquake fault zones and is vulnerable to significant damage from earthquakes. We are also vulnerable to other types of natural disasters and other events that could disrupt our operations, such as riot, civil disturbances, war, terrorist acts, flood, infections in our laboratory or production facilities or those of our contract manufacturers and other events beyond our control. We do not have a detailed disaster recovery plan. In addition, we do not carry insurance for earthquakes and we may not carry sufficient business interruption insurance to compensate us for losses that may occur. Any losses or damages we incur could have a material adverse effect on our cash flows and success as an overall business.
Ethical, legal and social concerns about genetically engineered products and processes could limit or prevent the use of our products, processes, and technologies and limit our revenues.
Some of our products and processes are genetically engineered or involve the use of genetically engineered products or genetic engineering technologies. If we and/or our collaborators are not able to overcome the ethical, legal, and social concerns relating to genetic engineering, our products and processes may not be accepted. Any of the risks discussed below could result in increased expenses, delays, or other impediments to our programs or the public acceptance and commercialization of products and processes dependent on our technologies or inventions. Our ability to develop and commercialize one or more of our technologies, products, or processes could be limited by the following factors:
• |
public attitudes about the safety and environmental hazards of, and ethical concerns over, genetic research and genetically engineered products and processes, which could influence public acceptance of our technologies, products and processes; |
• |
public attitudes regarding, and potential changes to laws governing ownership of genetic material, which could harm our intellectual property rights with respect to our genetic material and discourage collaborators from supporting, developing, or commercializing our products, processes and technologies; and |
• |
governmental reaction to negative publicity concerning genetically modified organisms, which could result in greater government regulation of genetic research and derivative products. The subject of genetically modified organisms has received negative publicity, which has aroused public debate. This adverse publicity could lead to greater regulation and trade restrictions on imports of genetically altered products. The biocatalysts that we develop have significantly enhanced characteristics compared to those found in naturally occurring enzymes or microbes. While we produce our biocatalysts only for use in a controlled industrial environment, the release of such biocatalysts into uncontrolled environments could have unintended consequences. Any adverse effect resulting from such a release could have a material adverse effect on our business and financial condition, and we may have exposure to liability for any resulting harm. |
We may not be able to obtain regulatory approval for the sale of our food products, if required, and, even if approvals are obtained, complying on an ongoing basis with the numerous regulatory requirements applicable to these products will be time-consuming and costly.
The product that we are currently developing for the food market is, and any other products that we may develop for this market will likely be, subject to regulation by various government agencies, including the FDA, state and local agencies and similar agencies outside the United States, as well as religious compliance certifying organizations. Food ingredients are regulated either as food additives or as substances generally recognized as safe, or GRAS. A substance can be listed or affirmed as GRAS by the FDA or self-affirmed by its manufacturer upon determination that independent qualified experts would generally agree that the substance is GRAS for a particular use. While we expect to self-affirm the product that we are currently developing for the food market, our customer will need to submit a GRAS Notice of Determination for the final commercial product. There can be no assurance that our customer will not receive any objections from the FDA to its Notice of Determination. If the FDA were to disagree with our customer’s determination, they could ask our customer to voluntarily withdraw the final commercial product from the market or could initiate legal action to halt its sale. Such actions by the FDA could have an adverse effect on our business, financial condition, and results of our operations. Food ingredients that are not GRAS are regulated as food additives and require FDA approval prior to commercialization. The food additive petition process is generally expensive and time consuming, with approval, if secured, taking years.
26
Changes in regulatory requirements, laws and policies, or evolving interpretations of existing regulatory requirements, laws and policies, may result in increased compliance costs, delays, capital expenditures and other financial obligations that could adversely affect our business or financial results.
We expect to encounter regulations in most if not all of the countries in which we may seek to sell our food products, and we cannot be sure that we will be able to obtain necessary approvals in a timely manner or at all. If our existing and future food products do not meet applicable regulatory requirements in a particular country or at all, then we may not be able to commercialize them and our business will be adversely affected. The various regulatory schemes applicable to our food products will continue to apply following initial approval for sale. Monitoring regulatory changes and ensuring our ongoing compliance with applicable requirements will be time-consuming and may affect our results of operations. If we fail to comply with such requirements on an ongoing basis, we may be subject to fines or other penalties, or may be prevented from selling our food products and our business may be harmed.
We use hazardous materials in our business and we must comply with environmental laws and regulations. Any claims relating to improper handling, storage or disposal of these materials or noncompliance of applicable laws and regulations could be time consuming and costly and could adversely affect our business and results of operations.
Our research and development and commercial processes involve the use of hazardous materials, including chemical, radioactive, and biological materials. Our operations also produce hazardous waste. We cannot eliminate entirely the risk of accidental contamination or discharge and any resultant injury from these materials. Federal, state, local and foreign laws and regulations govern the use, manufacture, storage, handling and disposal of, and human exposure to, these materials. We may be sued for any injury or contamination that results from our use or the use by third parties of these materials, and our liability may exceed our total assets. Although we believe that our activities comply in all material respects with environmental laws, there can be no assurance that violations of environmental, health and safety laws will not occur in the future as a result of human error, accident, equipment failure or other causes. Compliance with applicable environmental laws and regulations may be expensive, and the failure to comply with past, present, or future laws could result in the imposition of fines, third party property damage, product liability and personal injury claims, investigation and remediation costs, the suspension of production, or a cessation of operations, and our liability may exceed our total assets. Liability under environmental laws can be joint and several and without regard to comparative fault. Environmental laws could become more stringent over time imposing greater compliance costs and increasing risks and penalties associated with violations, which could impair our research, development or production efforts and harm our business. In addition, we may have to indemnify some of our customers or suppliers for losses related to our failure to comply with environmental laws, which could expose us to significant liabilities.
We may be sued for product liability.
The design, development, manufacture and sale of our products involve an inherent risk of product liability claims and the associated adverse publicity. For example, we may be named directly in product liability suits relating to drugs that are produced using our enzymes or that incorporate our intermediates and APIs. The biocatalysts, pharmaceutical intermediates and APIs that we produce or are produced for us by our manufacturing partners could be subject to quality control or contamination issues of which we are not aware. Claims could be brought by various parties, including customers who are purchasing products directly from us, other companies who purchase products from our customers or by the end users of the drugs. We could also be named as co-parties in product liability suits that are brought against our contract manufacturers who manufacture our enzymes, pharmaceutical intermediates and APIs, such as Lactosan. Insurance coverage is expensive and may be difficult to obtain, and may not be available in the future on acceptable terms, or at all. We cannot assure you that any contract manufacturer that we have used in the past or shall use in the future has or will have adequate insurance coverage to cover against potential claims. In addition, although we currently maintain product liability insurance for our products in amounts we believe to be commercially reasonable, if the coverage limits of these insurance policies are not adequate, a claim brought against us, whether covered by insurance or not, could have a material adverse effect on our business, results of operations, financial condition and cash flows. This insurance may not provide adequate coverage against potential losses, and if claims or losses exceed our liability insurance coverage, we may go out of business. Moreover, we have agreed to indemnify some of our customers for certain claims that may arise out of the use of our products, which could expose us to significant liabilities.
Our ability to use our net operating loss carryforwards to offset future taxable income may be subject to certain limitations.
In general, under Section 382 of the Internal Revenue Code, a corporation that undergoes an “ownership change” is subject to limitations on its ability to utilize its pre-change net operating loss carryforwards, or NOLs, to offset future taxable income. If the Internal Revenue Service challenges our analysis that our existing NOLs are not subject to limitations arising from previous ownership changes, our ability to utilize NOLs could be limited by Section 382 of the Internal Revenue Code. Future changes in our stock ownership, some of which are outside of our control, could result in an ownership change under Section 382 of the
27
Internal Revenue Code. Furthermore, our ability to utilize NOLs of companies that we may acquire in the future may be subject to limitations. For these reasons, we may not be able to utilize a material portion of the NOLs reflected in our financial statements, even if we attain profitability.
Risks Related to Owning our Common Stock
We are subject to anti-takeover provisions in our certificate of incorporation and bylaws and under Delaware law that could delay or prevent an acquisition of our company, even if the acquisition would be beneficial to our stockholders.
Provisions in our amended and restated certificate of incorporation and our bylaws may delay or prevent an acquisition of us. Among other things, our amended and restated certificate of incorporation and bylaws provide for a board of directors which is divided into three classes, with staggered three-year terms and provide that all stockholder action must be effected at a duly called meeting of the stockholders and not by a consent in writing, and further provide that only our board of directors, the chairman of the board of directors, our chief executive officer or president may call a special meeting of the stockholders. In addition, our amended and restated certificate of incorporation allows our board of directors, without further action by our stockholders, to issue up to 5,000,000 shares of preferred stock in one or more series and to fix the rights, preferences, privileges and restrictions thereof. These provisions may also frustrate or prevent any attempts by our stockholders to replace or remove our current management by making it more difficult for stockholders to replace members of our board of directors, who are responsible for appointing the members of our management team. Furthermore, because we are incorporated in Delaware, we are governed by the provisions of Section 203 of the Delaware General Corporation Law, which prohibits, with some exceptions, stockholders owning in excess of 15% of our outstanding voting stock from merging or combining with us. Finally, our charter documents establish advanced notice requirements for nominations for election to our board of directors and for proposing matters that can be acted upon at stockholder meetings. Although we believe these provisions together provide for an opportunity to receive higher bids by requiring potential acquirers to negotiate with our board of directors, they would apply even if an offer to acquire our company may be considered beneficial by some stockholders.
Concentration of ownership among our existing officers, directors and principal stockholders may prevent other stockholders from influencing significant corporate decisions and depress our stock price.
Based on the number of shares outstanding as of December 31, 2013, our officers, directors and stockholders who hold at least 5% of our stock together beneficially own approximately 37% of our outstanding common stock. If these officers, directors, and principal stockholders or a group of our principal stockholders act together, they will be able to exert a significant degree of influence over our management and affairs and control matters requiring stockholder approval, including the election of directors and approval of mergers or other business combination transactions. The interests of this concentration of ownership may not always coincide with our interests or the interests of other stockholders. For instance, officers, directors, and principal stockholders, acting together, could cause us to enter into transactions or agreements that we would not otherwise consider. Similarly, this concentration of ownership may have the effect of delaying or preventing a change in control of our company otherwise favored by our other stockholders. As of December 31, 2013, Raízen, Biomedical Sciences Investment Fund Pte Ltd. and CMEA Ventures beneficially owned approximately 15%, 8% and 8% of our common stock, respectively.
Our share price may be volatile which may cause the value of our common stock to decline and subject us to securities class action litigation.
The market price of shares of our common stock could be subject to wide fluctuations in response to many risk factors listed in this section, and others beyond our control, including:
• |
actual or anticipated fluctuations in our financial condition and operating results; |
• |
the position of our cash, cash equivalents and marketable securities; |
• |
actual or anticipated changes in our growth rate relative to our competitors; |
• |
actual or anticipated fluctuations in our competitors' operating results or changes in their growth rate; |
• |
announcements of technological innovations by us, our collaborators or our competitors; |
• |
announcements by us, our collaborators or our competitors of significant acquisitions or dispositions, strategic partnerships, joint ventures or capital commitments; |
• |
additions or losses of one or more significant pharmaceutical products; |
• |
announcements or developments regarding pharmaceutical products manufactured using our biocatalysts, intermediates and APIs; |
• |
the entry into, modification or termination of collaborative arrangements; |
• |
additions or losses of customers; |
• |
additions or departures of key management or scientific personnel; |
• |
competition from existing products or new products that may emerge; |
• |
issuance of new or updated research reports by securities or industry analysts; |
28
• |
fluctuations in the valuation of companies perceived by investors to be comparable to us; |
• |
disputes or other developments related to proprietary rights, including patent litigation and our ability to obtain patent protection for our technologies; |
• |
contractual disputes or litigation with our partners, customers or suppliers; |
• |
announcement or expectation of additional financing efforts; |
• |
sales of our common stock by us, our insiders or our other stockholders; |
• |
share price and volume fluctuations attributable to inconsistent trading volume levels of our shares; |
• |
general market conditions in our industry; and |
• |
general economic and market conditions, including the recent financial crisis. |
Furthermore, the stock markets have experienced extreme price and volume fluctuations that have affected and continue to affect the market prices of equity securities of many companies. These fluctuations often have been unrelated or disproportionate to the operating performance of those companies. These broad market and industry fluctuations, as well as general economic, political and market conditions such as recessions, interest rate changes or international currency fluctuations, may negatively impact the market price of shares of our common stock. In the past, companies that have experienced volatility in the market price of their stock have been subject to securities class action litigation. We may be the target of this type of litigation in the future. Securities litigation against us could result in substantial costs and divert our management's attention from other business concerns, which could seriously harm our business.
If securities or industry analysts do not publish research or reports about our business, or publish negative reports about our business, our stock price and trading volume could decline.
The trading market for our common stock will be influenced by the research and reports that securities or industry analysts publish about us or our business. We do not have any control over these analysts. If one or more of the analysts who cover us downgrade our stock or change their opinion of our stock in a negative manner, our stock price would likely decline. If one or more of these analysts cease coverage of our company or fail to regularly publish reports on us, we could lose visibility in the financial markets, which could cause our stock price or trading volume to decline.
We incur significant costs as a result of operating as a public company, and our management is required to devote substantial time to compliance initiatives.
As a public company, we incur significant legal, accounting and other expenses that we did not incur as a private company. In addition, the Sarbanes-Oxley Act and the Dodd-Frank Wall Street Reform and Consumer Protection Act, as well as related rules implemented by the Securities and Exchange Commission and The NASDAQ Stock Market, impose various requirements on public companies that require our management and other personnel to devote a substantial amount of time to compliance initiatives.
In addition, the Sarbanes-Oxley Act requires, among other things, that we maintain effective internal control over financial reporting and disclosure controls and procedures. In particular, we must perform system and process evaluation and testing of our internal control over financial reporting to allow management and our independent registered public accounting firm to report on the effectiveness of our internal control over financial reporting, as required by Section 404 of the Sarbanes-Oxley Act. Our compliance with Section 404 requires that we incur substantial accounting expense and expend significant management time on compliance-related issues. Moreover, if we are not able to maintain compliance with the requirements of Section 404, our stock price could decline, and we could face sanctions, delisting or investigations by The NASDAQ Global Market, or other material adverse effects on our business, reputation, results of operations, financial condition or liquidity.
ITEM 1B. UNRESOLVED STAFF COMMENTS
Not applicable.
ITEM 2. PROPERTIES
Facilities
Our headquarters are located in Redwood City, California, where we lease approximately 107,000 square feet of office and laboratory space. In March 2011, we entered into a Fifth Amendment to Lease (the “Fifth Amendment”) with Metropolitan Life Insurance Company (“MetLife”) with respect to our offices located at 200 and 220 Penobscot Drive, Redwood City, California, (the “Penobscot Space”), 400 Penobscot Drive, Redwood City, California (the “Building 2 Space”) and 640 Galveston Drive, Redwood City, California (the “Galveston Space”), and with respect to approximately 29,921 square feet of additional space located at 101 Saginaw Drive, Redwood City, California (the “Saginaw Space”). Under the Fifth Amendment, the term of the lease of the Penobscot Space, the Building 2 Space and the Saginaw Space lasts until January 31, 2020, and we have options to extend for two additional five year periods. Pursuant to the Fifth Amendment, we surrendered the Galveston Space in August 2011. In February 2014, we agreed to sublet approximately 26,000 square feet of the Saginaw Space to a subtenant for a period of three years, and the subtenant has two consecutive options to extend the sublease term for such portion of the Saginaw Space for an additional period of one year per option. We are currently marketing the remainder of the Saginaw Space for sublease.
We also lease space in the 501 Chesapeake Drive, Redwood City, California (the “501 Chesapeake Space”). In September 2012, we entered into a Sixth Amendment to Lease (the “Sixth Amendment”) with MetLife with respect to the 501 Chesapeake Space to extend the term of the lease of the 501 Chesapeake Space to January 31, 2017. Pursuant to the Sixth Amendment, we have two consecutive options to extend the term of the lease for the 501 Chesapeake Space for an additional period of five years per option.
29
We believe that the facilities that we currently lease in California are adequate for our needs for the immediate future and that, should it be needed, additional space can be leased to accommodate any future growth.
In Hungary, we occupy approximately 1,700 square meters (equivalent to approximately 18,000 square feet) of office and laboratory space under a lease that was scheduled to expire in September 2016.
ITEM 3. LEGAL PROCEEDINGS
We are not currently a party to any material litigation or other material legal proceedings.
ITEM 4. MINE SAFETY DISCLOSURES
Not applicable.
30
PART II
ITEM 5. MARKET FOR REGISTRANT’S COMMON EQUITY, RELATED STOCKHOLDER MATTERS AND ISSUER PURCHASES OF EQUITY SECURITIES
Market Information
Our common stock is quoted on The NASDAQ Global Select Market, or NASDAQ, under the symbol “CDXS.” The following table sets forth the high and low sales prices per share of the common stock as reported on NASDAQ. Such quotations represent inter dealer prices without retail markup, markdown or commission and may not necessarily represent actual transactions.
Fiscal 2013 |
High |
Low |
|||||
First Quarter |
$ |
2.67 |
$ |
2.00 |
|||
Second Quarter |
2.89 |
1.99 |
|||||
Third Quarter |
2.59 |
1.62 |
|||||
Fourth Quarter |
1.90 |
1.24 |
|||||
Fiscal 2012 |
High |
Low |
|||||
First Quarter |
$ |
6.12 |
$ |
3.45 |
|||
Second Quarter |
4.55 |
2.96 |
|||||
Third Quarter |
4.00 |
2.01 |
|||||
Fourth Quarter |
3.20 |
2.00 |
|||||
As of February 28, 2014, there were approximately 173 shareholders of record. A substantially greater number of stockholders may be “street name” or beneficial holders, whose shares are held of record by banks, brokers and other financial institutions.
Dividend Policy
We have never declared or paid cash dividends on our common stock, and currently do not plan to declare dividends on shares of our common stock in the foreseeable future. We expect to retain our future earnings, if any, for use in the operation and expansion of our business. The payment of cash dividends in the future, if any, will be at the discretion of our board of directors and will depend upon such factors as earnings levels, capital requirements, our overall financial condition and any other factors deemed relevant by our board of directors.
Unregistered Sales of Equity Securities
In December 2013, we issued 21,666 shares of our common stock to Latham & Watkins LLP upon the exercise in full of a stock option at an exercise price of $0.60 per share. We claimed exemption from registration under the Securities Act of 1933, as amended (the “Securities Act”), for the sale and issuance of these securities under Section 4(2) of the Securities Act in that such sale and issuance did not involve a public offering.
Use of Proceeds from Public Offering of Common Stock
There has been no material change in the planned use of proceeds from our IPO as described in our final prospectus filed with the SEC on April 22, 2010 pursuant to Rule 424(b). As of December 31, 2013, we have used approximately $42 million of the net offering proceeds for purchase and installation of machinery and equipment, continued investments in research and development, payment of restructuring costs, payment of taxes related to net share settlement of equity awards and working capital.
Stock Price Performance Graph
31
The following graph compares our total common stock return with the total return for (i) the NASDAQ Composite Index and (ii) the NASDAQ Biotechnology Index for the period April 22, 2010 through December 31, 2013. The figures represented below assume an investment of $100 in our common stock at the closing price on April 22, 2010 and in the NASDAQ Composite Index and the NASDAQ Biotechnology Index on April 22, 2010 and the reinvestment of dividends into shares of common stock. The comparisons in the table are required by the SEC and are not intended to forecast or be indicative of possible future performance of our common stock. This graph shall not be deemed “soliciting material” or to be “filed” for purposes of Section 18 of the Exchange Act or otherwise subject to the liabilities under that Section, and shall not be deemed to be incorporated by reference into any of our filings under the Securities Act or the Exchange Act.
32
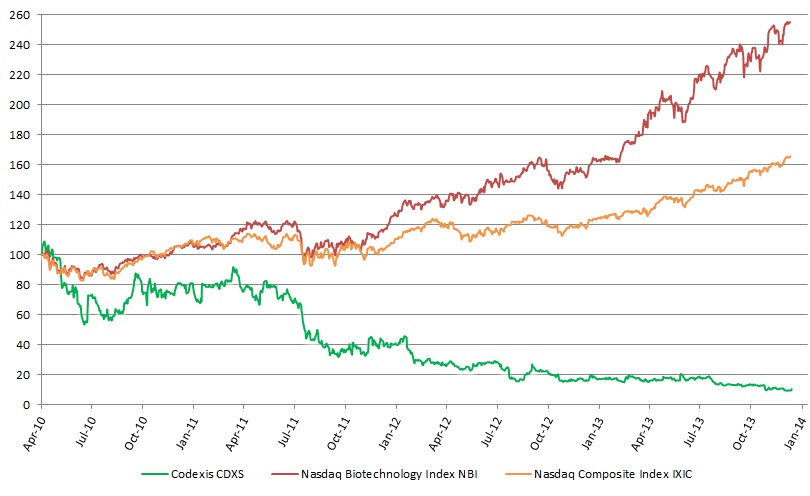
$100 investment in stock or index |
Ticker |
4/22/2010 |
6/30/2010 |
9/30/2010 |
12/31/2010 |
3/31/2011 |
6/30/2011 |
9/30/2011 |
12/31/2011 |
|||||||||||||||||
Codexis |
CDXS |
100.00 |
66.06 |
72.40 |
79.94 |
89.14 |
72.62 |
34.46 |
39.97 |
|||||||||||||||||
Nasdaq Composite Index |
IXIC |
100.00 |
83.73 |
94.03 |
105.31 |
110.40 |
110.10 |
95.88 |
103.42 |
|||||||||||||||||
Nasdaq Biotechnology Index |
NBI |
100.00 |
86.13 |
96.40 |
104.46 |
112.07 |
119.34 |
104.40 |
116.79 |
|||||||||||||||||
$100 investment in stock or index |
Ticker |
3/31/2012 |
6/30/2012 |
9/30/2012 |
12/31/2012 |
3/31/2013 |
6/30/2013 |
9/30/2013 |
12/31/2013 |
|||||||||||||||||
Codexis |
CDXS |
27.53 |
27.98 |
22.85 |
16.67 |
18.02 |
16.67 |
13.27 |
10.56 |
|||||||||||||||||
Nasdaq Composite Index |
IXIC |
122.73 |
116.51 |
123.71 |
119.87 |
129.71 |
135.10 |
149.72 |
165.80 |
|||||||||||||||||
Nasdaq Biotechnology Index |
NBI |
137.94 |
145.53 |
160.02 |
154.06 |
179.73 |
195.22 |
235.68 |
255.13 |
|||||||||||||||||
33
ITEM 6. SELECTED FINANCIAL DATA
The following selected consolidated financial data should be read together with our consolidated financial statements and accompanying notes and “Management’s Discussion and Analysis of Financial Condition and Results of Operations” appearing elsewhere in this Annual Report on Form 10-K. The selected consolidated financial data in this section is not intended to replace our consolidated financial statements and the accompanying notes. Our historical results are not necessarily indicative of our future results.
We derived the consolidated statements of operations data for the fiscal years ended December 31, 2013, 2012, and 2011 and the consolidated balance sheets data as of December 31, 2013 and 2012 from our audited consolidated financial statements appearing elsewhere in this filing. The consolidated statements of operations data for the fiscal years ended December 31, 2010 and 2009 and the consolidated balance sheets data as of December 31, 2011, 2010 and 2009 have been derived from our audited consolidated financial statements not included in this filing. The data should be read in conjunction with the consolidated financial statements, related notes, and other financial information included herein.
SELECTED CONSOLIDATED FINANCIAL DATA
Years Ended December 31, |
|||||||||||||||||||
2013 |
2012 |
2011 |
2010 |
2009 |
|||||||||||||||
(In Thousands, Except Per Share Amounts) |
|||||||||||||||||||
Consolidated Statements of Operations Data: |
|||||||||||||||||||
Revenues: |
|||||||||||||||||||
Product revenues |
$ |
20,423 |
$ |
35,924 |
$ |
49,021 |
$ |
32,835 |
$ |
18,554 |
|||||||||
Collaborative research and development |
6,868 |
49,977 |
70,918 |
70,196 |
64,308 |
||||||||||||||
Revenue sharing arrangement |
4,631 |
150 |
450 |
— |
— |
||||||||||||||
Government awards |
— |
2,247 |
3,476 |
4,073 |
46 |
||||||||||||||
Total revenues |
31,922 |
88,298 |
123,865 |
107,104 |
82,908 |
||||||||||||||
Costs and operating expenses: |
|||||||||||||||||||
Cost of product revenues |
14,554 |
30,647 |
41,781 |
27,982 |
16,678 |
||||||||||||||
Research and development |
31,606 |
56,785 |
61,049 |
52,405 |
54,725 |
||||||||||||||
Selling, general and administrative |
26,908 |
31,379 |
36,942 |
33,841 |
29,871 |
||||||||||||||
Total costs and operating expenses |
73,068 |
118,811 |
139,772 |
114,228 |
101,274 |
||||||||||||||
Loss from operations |
(41,146 |
) |
(30,513 |
) |
(15,907 |
) |
(7,124 |
) |
(18,366 |
) |
|||||||||
Interest income |
60 |
252 |
273 |
166 |
180 |
||||||||||||||
Interest expense and other, net |
(304 |
) |
(326 |
) |
(675 |
) |
(1,199 |
) |
(2,037 |
) |
|||||||||
Loss before income taxes |
(41,390 |
) |
(30,587 |
) |
(16,309 |
) |
(8,157 |
) |
(20,223 |
) |
|||||||||
Provision for (benefit from) income taxes |
(87 |
) |
270 |
241 |
384 |
66 |
|||||||||||||
Net loss |
$ |
(41,303 |
) |
$ |
(30,857 |
) |
$ |
(16,550 |
) |
$ |
(8,541 |
) |
$ |
(20,289 |
) |
||||
Net loss per share, basic and diluted |
$ |
(1.08 |
) |
$ |
(0.84 |
) |
$ |
(0.46 |
) |
$ |
(0.35 |
) |
$ |
(7.74 |
) |
||||
Weighted average common shares used in computing net loss per share, basic and diluted |
38,231 |
36,768 |
35,674 |
24,594 |
2,622 |
||||||||||||||
34
December 31, |
|||||||||||||||||||
2013 |
2012 |
2011 |
2010 |
2009 |
|||||||||||||||
Consolidated Balance Sheets Data: |
(In Thousands) |
||||||||||||||||||
Cash, cash equivalents and marketable securities, current |
$ |
25,135 |
$ |
45,527 |
$ |
53,482 |
$ |
72,396 |
$ |
55,563 |
|||||||||
Working capital |
24,582 |
43,486 |
50,940 |
64,708 |
16,397 |
||||||||||||||
Total assets |
58,840 |
99,965 |
135,922 |
141,300 |
99,036 |
||||||||||||||
Current and long-term financing obligations |
— |
— |
— |
— |
7,942 |
||||||||||||||
Redeemable convertible preferred stock |
— |
— |
— |
— |
179,672 |
||||||||||||||
Total stockholders’ equity (deficit) |
41,483 |
78,440 |
102,690 |
107,361 |
(144,845 |
) |
|||||||||||||
ITEM 7. MANAGEMENT’S DISCUSSION AND ANALYSIS OF
FINANCIAL CONDITION AND RESULTS OF OPERATIONS
The following discussion and analysis should be read in conjunction with our audited consolidated financial statements and the related notes that appear elsewhere in this Annual Report on Form 10-K. This Annual Report on Form 10-K contains “forward-looking statements” within the meaning of Section 21E of the Securities Exchange Act of 1934, as amended, or the Exchange Act. These statements are often identified by the use of words such as “may,” “will,” “expect,” “believe,” “anticipate,” “intend,” “could,” “should,” “estimate,” or “continue,” and similar expressions or variations. Such forward-looking statements are subject to risks, uncertainties and other factors that could cause actual results and the timing of certain events to differ materially from future results expressed or implied by such forward-looking statements. Factors that could cause or contribute to such differences include, but are not limited to, those discussed in the section titled “Risk Factors,” set forth in Part I, Item 1A of this Annual Report on Form 10-K and elsewhere in this report. The forward-looking statements in this Annual Report on Form 10-K represent our views as of the date of this Annual Report on Form 10-K. We anticipate that subsequent events and developments will cause our views to change. However, while we may elect to update these forward-looking statements at some point in the future, we have no current intention of doing so except to the extent required by applicable law. You should, therefore, not rely on these forward-looking statements as representing our views as of any date subsequent to the date of this Annual Report on Form 10-K.
Business Overview
We develop biocatalysts for the pharmaceutical and fine chemicals markets. Our proven technologies enable scale-up and implementation of biocatalytic solutions to meet customer needs for rapid, cost-effective and sustainable process development, from research to manufacturing.
Biocatalysts are enzymes or microbes that initiate and/or accelerate chemical reactions. Manufacturers have historically used naturally occurring biocatalysts to produce many goods used in everyday life. However, inherent limitations in naturally occurring biocatalysts have restricted their commercial use. Our proprietary technology platform is able to overcome many of these limitations, allowing us to evolve and optimize biocatalysts to perform specific and desired chemical reactions at commercial scale.
We have commercialized our technology and products in the pharmaceuticals market, which is our primary business focus. Our pharmaceutical customers, which include several of the largest global pharmaceutical companies, use our technology, products and services in their manufacturing process development, including in the production of some of the world's bestselling and fastest growing drugs.
We have recently begun to use our technology to develop biocatalysts for use in the fine chemicals markets. The fine chemicals market is similar to our pharmaceutical business and consists of several large market segments, including food, animal feed, polymers, flavors and fragrances and agricultural chemicals, and so it is a natural fit for our technology.
We create our products by applying our CodeEvolver® directed evolution technology platform, which introduces genetic mutations into microorganisms, giving rise to changes in the enzymes that they produce. Once we identify potentially beneficial mutations, we test combinations of these mutations until we have created variant enzymes that exhibit marketable performance characteristics superior to competitive products. This process allows us to make continuous, efficient improvements to the performance of our enzymes.
Results of Operations Overview
35
In 2013, revenues totaled $31.9 million, compared to $88.3 million in 2012. Product revenues decreased to $20.4 million in 2013 from $35.9 million in 2012 as a result of reduced shipments primarily due to the decrease in sales of our statin-family of products for off-patent applications. Revenues from collaborative research and development decreased to $6.9 million in 2013 from $50.0 million in 2012 as a result of the termination of our collaborative research agreement with Shell (the “Shell Research Agreement”) in 2012. Revenue sharing arrangement revenues increased to $4.6 million in 2013 from $0.2 million in 2012 as a result of volume shipments of Argatroban and more frequent reporting from our partner, Exela. While we expect pharmaceutical product sales to increase in future periods, the timing of orders and delivery of product will continue to fluctuate from quarter-to-quarter, and may not be comparable on a sequential or year over year basis.
Costs and operating expenses in 2013 totaled $73.1 million, compared to $118.8 million in 2012. Cost of product revenues decreased to $14.6 million in 2013 from $30.6 million in 2012 as a result of lower product revenues. Our gross margin percentage increased to 29% in 2013 compared to 15% in 2012 as a result of reduced shipments of lower margin statin-family products. Research and development expense decreased to $31.6 million in 2013 from $56.8 million in 2012 as a result of reduced headcount-related costs following our restructuring efforts as a result of the termination of the Shell Research Agreement in 2012. Selling, general and administrative expenses decreased to $26.9 million in 2013 from $31.4 million in 2012 as a result of reduced headcount-related costs following our restructuring efforts as a result of the termination of the Shell Research Agreement in 2012.
Net loss for the twelve months ended December 31, 2013 totaled $41.3 million compared to $30.9 million net loss for the twelve months ended December 31, 2012. The increased loss is primarily related to lower collaborative research revenues related to the terminated Shell Research Agreement, partially offset by reduced research spending.
Cash, cash equivalents and marketable securities balances declined to $25.9 million as of December 31, 2013 compared to $49.1 million as of December 31, 2012. We are actively partnering with new and existing pharmaceutical customers and we believe that we can utilize our products and services, and develop new products and services, that will increase our revenue and gross margins in future periods. We believe that, based on our current level of operations, our existing cash, cash equivalents and marketable securities will provide adequate funds for ongoing operations, planned capital expenditures and working capital requirements for at least the next 12 months.
CodeXyme® Cellulase Enzyme and CodeXol® Detergent Alcohols Businesses
During 2013 we continued a reduced level of spending in biofuels research while efforts were made to obtain funding or sell the rights for this business. In the fourth quarter of 2013, we announced that we would begin winding down our CodeXyme® cellulase enzymes program and stop further development of our CodeXol® detergent alcohols program. As a result, we have committed to a restructuring plan to reduce our cost structure to align with our projected future revenues from our pharmaceutical business. The restructuring plan includes a reduction of employees in the United States and Hungary and the sale of excess assets which will reduce future research and development costs and related expenditures. We have recorded restructuring charges of $0.8 million in the year ended December 31, 2013, which included a total of 15 employee terminations in the United States. We also recorded $1.6 million in asset impairment charges related to excess equipment reclassified as held for sale as of December 31, 2013.
Termination of Shell Collaboration
The Shell Research Agreement was terminated effective August 31, 2012 and as a result, we no longer receive collaborative research and development revenues from Shell. This has significantly decreased our revenues as compared to prior periods. We received no revenues from Shell for the twelve months ended December 31, 2013. Collaborative research and development revenue received from Shell accounted for $45.3 million and $63.2 million for the twelve months ended December 31, 2012 and 2011, respectively.
As a result of the termination of the Shell Research Agreement, we initiated a series of cost reduction measures in 2012 and refocused our business on the pharmaceuticals market. We terminated approximately 173 employees worldwide in the fourth quarter of 2012, consisting of 150 research and development staff and 23 general and administrative staff. We also closed our Singapore research and development facility in December 2012. We incurred $2.4 million in restructuring expenses related to these cost reduction measures, including severance for terminated employees, and other exit-related costs arising from contractual obligations associated with closed facilities under lease and equipment disposals. During 2013, we made cash payments of $0.3 million. As of December 31, 2013, we had paid out substantially all of the costs under this restructuring plan.
Arch Contract Manufacturing Collaboration
From 2006 through November 2012, Arch Pharma Labs of Mumbai, India manufactured substantially all of our commercialized intermediates and APIs for sale to generic and innovator pharmaceutical manufacturers. Prior to November
36
2012, Arch produced atorva-family API's and intermediates for us and we sold these directly to end customers primarily in India. In November 2012, we entered into a new commercial arrangement with Arch (the "New Arch Enzyme Supply Agreement") whereby we will supply Arch with enzymes for use in the manufacture of atorva family products and Arch will market these products directly to end customers. During 2013, Arch was unable to competitively supply these products to end customers, resulting in a significant decrease in revenues. For the twelve months ended December 31, 2013, we recognized $2.1 million in product revenue for the sale of enzyme inventory to Arch pursuant to the New Arch Enzyme Supply Agreement. During 2013, we recorded an allowance for bad debt of approximately $0.4 million due to a write-off of an accounts receivable from Arch. The 2013 revenue for the sale of enzyme inventory related to a sale of inventory that occurred in 2012 for which the recognition of revenue was deferred until 2013 when all of the revenue recognition criteria were met. We do not anticipate significant Arch product revenues in future periods.
Critical Accounting Policies and Estimates
Management’s discussion and analysis of our financial condition and results of operations are based upon our consolidated financial statements. The consolidated financial statements have been prepared in conformity with generally accepted accounting principles in the United States and include our accounts and the accounts of our wholly-owned subsidiaries. The preparation of our consolidated financial statements requires our management to make estimates, assumptions, and judgments that affect the reported amounts of assets and liabilities and disclosure of contingent assets and liabilities at the date of the financial statements, and the reported amounts of revenues and expenses during the applicable periods. Management bases its estimates, assumptions and judgments on historical experience and on various other factors that are believed to be reasonable under the circumstances. Different assumptions and judgments would change the estimates used in the preparation of our consolidated financial statements, which, in turn, could change the results from those reported. Our management evaluates its estimates, assumptions and judgments on an ongoing basis.
The critical accounting policies requiring estimates, assumptions, and judgments that we believe have the most significant impact on our consolidated financial statements are described below.
Revenue Recognition
Revenues are recognized when the four basic revenue recognition criteria are met: (1) persuasive evidence of an arrangement exists; (2) products have been delivered, transfer of technology has been completed or services have been rendered; (3) the fee is fixed or determinable; and (4) collectability is reasonably assured.
Our primary sources of revenues consist of product revenues, collaborative research and development agreements, revenue sharing arrangement and government awards. Collaborative research and development agreements typically provide us with multiple revenue streams, including up-front fees for licensing, exclusivity and technology access, fees for full-time employee (“FTE”) services, milestone payments recognized upon achievement of contractual criteria, and royalty fees based on licensees' sales of products using our technologies.
Product revenues are recognized once passage of title and risk of loss has occurred and contractually specified acceptance criteria, if any, have been met, provided all other revenue recognition criteria have also been met. Product revenues consist of sales of biocatalysts, intermediates, active pharmaceutical ingredients and Codex Biocatalyst Panels and Kits. Cost of product revenues includes both internal and third party fixed and variable costs including amortization of purchased technology, materials and supplies, labor, facilities and other overhead costs associated with our product revenues.
Revenue sharing arrangement revenues are recognized based upon sales of licensed products by our revenue share partner Exela. Revenue share amounts received are net of product and selling costs. Revenue is recognized as earned in accordance with contract terms, and is recorded when revenue share amounts can be reasonably estimated and collectability is assured. We base our estimates on notification of the sale of revenue sharing products and related costs by our revenue share partner.
Up-front fees received in connection with collaborative research and development agreements, including license fees, technology access fees, and exclusivity fees, are deferred upon receipt, are not considered a separate unit of accounting and are recognized as revenues over the relevant performance periods related to the combined units of accounting appropriate for each customer arrangement.
Revenues related to FTE services recognized as research services are performed over the related performance periods for each contract. We are required to perform research and development activities as specified in each respective agreement. The payments received are not refundable and are based on a contractual reimbursement rate per FTE working on the project. When up-front payments are combined with FTE services in a single unit of accounting, we recognize the up-front payments using
37
the proportionate performance method of revenue recognition based upon the actual amount of research and development labor hours incurred relative to the amount of the total expected labor hours to be incurred by us, up to the amount of cash received. In cases where the planned levels of research services fluctuate substantially over the research term, we are required to make estimates of the total hours required to perform our obligations. Research and development expenses related to FTE services under the collaborative research and development agreements approximate the research funding over the term of the respective agreements.
A payment that is contingent upon the achievement of a substantive milestone is recognized in its entirety in the period in which the milestone is achieved. A milestone is an event (i) that can only be achieved based in whole or in part on either our performance or on the occurrence of a specific outcome resulting from our performance, (ii) for which there is substantive uncertainty at the date the arrangement is entered into that the event will be achieved, and (iii) results in additional payments being due to us. Milestones are considered substantive when the consideration earned from the achievement of the milestone (i) is commensurate with either our performance to achieve the milestone or the enhancement of value of the item delivered as a result of a specific outcome resulting from its performance, (ii) relates solely to past performance, and (iii) is reasonable relative to all deliverable and payment terms in the arrangement.
Other payments received for which such payments are contingent solely upon the passage of time or the result of a collaborative partner’s performance are recognized as revenue when earned in accordance with the contract terms and when such payments can be reasonably estimated and collectability is reasonably assured.
We recognize revenues from royalties based on licensees’ sales of products using our technologies. Royalties are recognized as earned in accordance with the contract terms when royalties from licensees can be reasonably estimated and collectability is reasonably assured. We base its estimates on notification of the sale of licensed products from licensees.
Though we received payments from government entities for work performed in the form of government awards. Government awards are agreements that generally provide us with cost reimbursement for certain types of expenditures in return for research and development activities over a contractually defined period. Revenues from government awards are recognized in the period during which the related costs are incurred, provided that the conditions under which the government awards were provided have been met and we have only perfunctory obligations outstanding.
Shipping and handling costs charged to customers are recorded as revenues. Shipping costs are included in our cost of product revenues. Such charges were not significant in any of the periods presented.
Stock-Based Compensation
We recognize compensation expense related to share-based transactions, including the awarding of employee stock options, restricted stock units (“RSU”), restricted stock awards ("RSA") and performance stock units ("PSU"), based on the estimated fair value of the awards granted.
We estimate the fair value of our stock option grants using the Black-Scholes option-pricing model. We calculate the estimated volatility rate based on historical volatility of our common stock. Due to our limited history of grant activity, we calculate the expected life of options granted to employees using the “simplified method” permitted by the United States Securities Exchange Commission, or SEC, as the average of the total contractual term of the option and its vesting period. The risk-free rate assumption was based on United States Treasury instruments whose terms were consistent with the terms of our stock options. The expected dividend assumption was based on our history and expectation of dividend payouts. The fair value of each restricted stock unit grant and each performance stock unit grant is based on the underlying value of our common stock on the date of grant. In addition, we estimate the expected forfeiture rate and only recognize expense for those awards expected to vest. We estimate the forfeiture rate based on historical experience and to the extent the actual forfeiture rate is different from the estimate, share-based compensation expense is adjusted accordingly.
We account for stock awards issued to non-employees based on their estimated fair value determined using the Black-Scholes option-pricing model. The fair value of the awards granted to non-employees is re-measured as they vest, and the resulting increase in value, if any, is recognized as expense during the period the related services are rendered.
Assets Held for Sale
We reclassify long-lived assets to Assets Held for Sale when all required criteria are met. The assets are recorded at the lower of the carrying value or fair value less costs to sell. Assets held for sale must meet the following conditions: 1) management, having authority to approve the action, commits to a plan to sell the asset, 2) the asset is available for immediate sale in its present condition, 3) an active program to locate a buyer and other actions required to complete the plan to sell the asset have been initiated, 4) the sale of the asset is probable, and transfer of the asset is expected to qualify for recognition as a completed
38
sale, within one year, 5) the asset is being actively marketed for sale at a price that is reasonable in relation to its current fair value, and 6) actions required to complete the plan indicate that it is unlikely that significant changes to the plan will be made or that the plan will be withdrawn.
In determining the fair value of the assets less cost to sell, we consider factors including current sales prices for comparable assets, recent market analysis studies, appraisals and any recent legitimate offers. If the estimated fair value, less the cost to sell an asset, is less than its current carrying value, the asset is written down to its estimated fair value less cost to sell. Due to uncertainties in the estimation process, it is reasonably possible that actual results could differ from the estimates used in our historical analyses. The assumptions about equipment sales prices require significant judgment related to equipment condition and certain selling costs. We calculate the estimated fair values of assets held for sale based on current market conditions and assumptions made by management, which may differ from actual results and may result in additional impairments if market conditions deteriorate.
Impairment of Long-Lived Assets and Intangible Assets
Long-lived and intangible assets with finite lives are reviewed for impairment whenever events or changes in circumstances indicate the carrying amount of an asset may not be recoverable. Recoverability of these assets is measured by comparison of their carrying amounts to future undiscounted cash flows the assets are expected to generate.
Our intangible assets with finite lives consist of customer relationships, developed core technology, trade names, and the intellectual property (“IP”) rights associated with the acquisition of Maxygen's directed evolution technology in 2010. Intangible assets were recorded at their fair values at the date we acquired the assets and, for those assets having finite useful lives, are amortized using the straight-line method over their estimated useful lives. Our long-lived assets include property, plant and equipment, and other non-current assets.
We determined that the Company has a single entity wide asset group (“Asset Group”). The directed evolution technology patent portfolio acquired from Maxygen (“Core IP”) is the most significant component of the Asset Group since it is the base technology for all aspects of our research and development, and represents the basis for all of our identifiable cash flow generating capacity. Consequently, we do not believe that identification of independent cash flows associated with our long-lived assets is currently possible at any lower level than the Asset Group.
The Core IP is the only finite-lived intangible asset on our balance sheet as of December 31, 2013 and is considered the primary asset within the Asset Group. The remaining useful life of the Core IP extends through the fourth quarter of 2016. There has been no significant change in the utilization or estimated life of our Core IP since we acquired the technology patent portfolio from Maxygen. The estimated remaining useful life of our Core IP is not impacted by the termination of the Shell Research Agreement or our exiting the biofuels market.
The carrying value of our long-lived assets in the Asset Group may not be recoverable based upon the existence of one or more indicators of impairment which could include: a significant decrease in the market price of our common stock; current period cash flow losses or operating losses combined with a history of losses or a forecast of continuing losses associated with the use of the assets; slower growth rates in our industry; significant adverse changes in the business climate or legal factors; accumulation of costs significantly in excess of the amount originally expected for the acquisition or construction of the assets; loss of significant customers or partners; or the current expectation that the assets will more likely than not be sold or disposed of significantly before the end of their estimated useful life.
We evaluate recoverability of our long-lived assets and intangible assets based on the sum of the undiscounted cash flows expected to result from the use, and the eventual disposal of, the Asset Group. We make estimates and judgments about the future undiscounted cash flows over the remaining useful life of the Asset Group. Our anticipated future cash flows include our estimates of existing or in process product revenues, production and operating costs, future capital expenditures, working capital needs, and assumptions regarding the ultimate sale of the Asset Group at the end of the life of the primary asset. The useful life of the Asset Group was based on the estimated useful life of the Core IP, the primary asset at the time of acquisition. There has been no change in the estimated useful life of the Asset Group. Although our cash flow forecasts are based on assumptions that are consistent with our plans, there is significant judgment involved in determining the cash flows attributable to our Asset Group over its estimated remaining useful life.
2012 Analysis
As of December 31, 2012 we determined that our continued operating losses and the termination of the Shell Research Agreement were indicators of impairment.
39
As a result, in 2012 we performed the recoverability test and calculated estimated cashflows through the remaining period of the estimated useful life of the Core IP. The undiscounted cash flows included revenue and expense from our biocatalyst business, both from the pharmaceuticals market and from enzyme markets adjacent to our business in the pharmaceuticals market, including fine chemicals markets.
We typically receive revenues from the pharmaceuticals market and expect to receive revenues from other enzyme markets adjacent to our pharmaceutical business in the form of one or more of the following: up-front payments, milestone payments, payments based upon the number of FTEs engaged in related research and development activities and licensing fees and royalties. Our best estimate of future cash flows did not include any CodeXol® and CodeXyme® revenues associated with collaboration research and development agreements, but did include an estimate of cash flows from potential strategic transactions with respect to our CodeXyme® and CodeXol® programs, as described below.
In our 2012 impairment analysis, approximately 69% and 31% of total Company revenues included in the estimated undiscounted cash flows (excluding cash flows from potential strategic transactions with respect to our CodeXyme® and CodeXol® programs) over the remaining useful life of the Core IP were derived from the pharmaceuticals market and from adjacent enzyme market opportunities, respectively.
Our pharmaceuticals revenues were estimated based on existing commercial relationships, signed agreements or contracts, and conservative estimates for the capture of additional market share that management determined to be reasonably achievable. For existing and in process customer revenues we assumed a modest rate of growth based on our historical business model for our core pharmaceutical business, including research and development services revenue from partners and customers, which management determined to be reasonably achievable. We have historically worked closely with our pharmaceutical partners to evolve, engineer and develop enzymes that meet their specific needs. Our business model is based on having our partners and customers pay in whole or in part for the research and development required to engineer the enzymes required.
In determining which adjacent enzyme markets to exploit, management assessed various segments of the large and growing enzyme markets and selected those adjacent markets where we already had entry points through our existing pharmaceutical business relationships, such as fine chemicals markets. Estimated revenues associated with these adjacent markets were based on market penetration and adoption rates that management determined to be reasonably achievable.
The expected residual value was determined by applying a Gordon Growth Model to normalized net cash flows using a discount rate of 18.0% (“Estimated Weighted-Average Cost of Capital”) and a long term growth rate of 2%. The 18.0% discount rate reflects the nature and the risk of the underlying forecast, and includes such financial components as the risk free rate, systemic stock price risk based on an evaluation with peer companies (“beta”), equity risk premium, size premium, and company specific risk. The long term growth rate of 2% reflects projected inflation and general economic conditions.
We also included in the undiscounted cash flows an estimate of cash flows from potential strategic transactions with respect to our CodeXyme® cellulase enzymes and CodeXol® detergent alcohol programs. The amount of estimated cash flows related to CodeXol® and CodeXyme® represented 38% of the total undiscounted cash flows associated with the Asset Group. These amounts were not based on any existing contracts or agreements.
The results of our fourth quarter 2012 impairment analysis indicated that the undiscounted cash flows for the Asset Group were greater than the carrying value of the Asset Group by approximately 14%. Based on the results obtained, we determined there was no impairment of our intangible assets as of December 31, 2012.
2013 Analysis
In the fourth quarter of 2013, we determined that continued operating losses and a decline in market price of our common stock, reduced anticipated future cashflows related to potential CodeXyme® cellulase enzyme and CodeXol® detergent alcohols transactions and reduced future revenue growth to reflect the Company’s most recent outlook were indicators of impairment.
As a result, in the fourth quarter of 2013 we performed the recoverability test and calculated estimated cashflows through the remaining period of the estimated useful life of the Core IP. The undiscounted cash flows included revenue and expense from our biocatalyst business, both from the pharmaceuticals market and from enzyme markets adjacent to our business in the pharmaceuticals market, including fine chemicals markets.
The methodology employed in our 2013 analysis was consistent with that used in our impairment analysis performed as of December 31, 2012, although certain assumptions changed in 2013 based on new developments, including reduced anticipated future cashflows related to potential strategic transactions with respect to our CodeXyme® and CodeXol® programs, and reduced future revenue growth to reflect the Company’s most recent outlook and an increase in our fine chemicals activities.
40
In our 2013 impairment analysis, approximately 90% and 10% of total Company revenues included in our estimated undiscounted cash flows (excluding cash flows from potential strategic transactions with respect to our CodeXyme® and CodeXol® programs) over the remaining useful life of the Core IP were derived from the pharmaceuticals market and from adjacent enzyme market opportunities, respectively.
The expected residual value was determined by applying a Gordon Growth Model to normalized net cash flows using a discount rate of 19.5% (“Estimated Weighted-Average Cost of Capital”) and a long term growth rate of 2%. The 19.5% discount rate reflects the nature and the risk of the underlying forecast, and includes such financial components as the risk free rate, systemic stock price risk based on an evaluation with peer companies (“beta”), equity risk premium, size premium, and company specific risk. The long term growth rate of 2% reflects projected inflation and general economic conditions.
We also included in the undiscounted cash flows an estimate of cash flows from potential strategic transactions with respect to our CodeXyme® cellulase enzymes and CodeXol® detergent alcohol programs. The amount of estimated cash flows related to CodeXol® and CodeXyme® represented 7% of the total undiscounted cash flows associated with the Asset Group. These amounts are not based on any existing contracts or agreements.
The results of our fourth quarter 2013 impairment analysis indicated that the undiscounted cash flows for the Asset Group were greater than the carrying value of the Asset Group by approximately 37%. Based on the results obtained, we determined there was no impairment of our intangible assets as of December 31, 2013.
Although our analysis indicated that the estimated future undiscounted cash flows exceeded the carrying value of the Asset Group, we performed a supplemental analysis to determine the fair value of the Core IP. In determining the fair value, we prepared cash flow forecasts over the remaining economic life of the Core IP primarily related to final patent expiration from the Maxygen patent portfolio. We utilized the multi-period Excess Earnings model and obtained key financial inputs from review of market participants, Company specific factors and generally accepted valuation methods. We utilized a discount rate of 19.5% which reflects the nature and the risk of the underlying forecast and includes other financial components. Based on these estimates, judgments and factors, we have determined that the fair value of the Core IP exceeded its carrying value by 44% as of December 31, 2013.
Valuation of Goodwill
Goodwill represents the excess of the purchase price over the fair value of assets acquired and liabilities assumed. Goodwill is presumed to have an indefinite life and is not subject to amortization. Goodwill is reviewed for impairment annually in the fourth quarter of each of its fiscal years. and whenever events or changes in circumstances indicate that the carrying value of the goodwill may not be recoverable.
We determined that we have only one operating segment and reporting unit under the criteria in ASC 280, Segment Reporting. Accordingly, our review of goodwill impairment indicators is performed at the Company level.
The goodwill impairment test consists of a two-step process. The first step of the goodwill impairment test, used to identify potential impairment, compares the fair value of the reporting unit to its carrying value. If the fair value of the reporting unit exceeds its carrying amount, goodwill of the reporting unit is considered not impaired, and the second step of the impairment test is not required.
We use our market capitalization as an indicator of fair value. We believe that since our reporting unit is publicly traded, the ability of a controlling shareholder to benefit from synergies and other intangible assets that arise from control might cause the fair value of our reporting unit as a whole to exceed our market capitalization. However, we believe that the fair value measurement need not be based solely on the quoted market price of an individual share of our common stock, but also can consider the impact of a control premium in measuring the fair value of its reporting unit.
Should our market capitalization be less than our total stockholder's equity as of our annual test date or as of any interim impairment testing date, we would also consider market comparables, recent trends in our stock price over a reasonable period and, if appropriate, use an income approach (discounted cash flow) to determine whether the fair value of our reporting unit is greater than our carrying amount.
If we were to use an income approach we would establish a fair value by estimating the present value of our projected future cash flows expected to be generated from our business. The discount rate applied to the projected future cash flows to arrive at the present value would be intended to reflect all risks of ownership and the associated risks of realizing the stream of projected future cash flows. Our discounted cash flow methodology would consider projections of financial performance for a period of several years combined with an estimated residual value. The most significant assumptions we would use in a discounted cash
41
flow methodology are the discount rate, the residual value and expected future revenues, gross margins and operating costs, along with considering any implied control premium.
The second step, if required, compares the implied fair value of the reporting unit goodwill with the carrying amount of that goodwill. If the carrying amount of the reporting unit's goodwill exceeds its implied fair value, an impairment charge is recognized in an amount equal to that excess. Implied fair value is the excess of the fair value of the reporting unit over the fair value of all identified assets and liabilities. We base our fair value estimates on assumptions we believe to be reasonable. Actual future results may differ from those estimates.
Goodwill was tested for impairment in the fourth quarter of 2013. We concluded that the fair value of the reporting unit exceeded the carrying value and no impairment existed. No impairment charges were recorded during the years ended December 31, 2013, 2012 and 2011.
Income Taxes
We use the liability method of accounting for income taxes, whereby deferred tax assets or liability account balances are calculated at the balance sheet date using current tax laws and rates in effect for the year in which the differences are expected to affect taxable income. Valuation allowances are provided when necessary to reduce deferred tax assets to the amount that will more likely than not be realized.
We make certain estimates and judgments in determining income tax expense for financial statement purposes. These estimates and judgments occur in the calculation of tax credits, benefits and deductions and in the calculation of certain tax assets and liabilities, which arise from differences in the timing of recognition of revenues and expenses for tax and financial statement purposes. Significant changes to these estimates may result in an increase or decrease to our tax provision in a subsequent period.
In assessing the realizability of deferred tax assets, we consider whether it is more likely than not that some portion or all of the deferred tax assets will be realized on a jurisdiction by jurisdiction basis. The ultimate realization of deferred tax assets is dependent upon the generation of taxable income in the future. We have recorded a deferred tax asset in jurisdictions where ultimate realization of deferred tax assets is more likely than not to occur.
We make estimates and judgments about our future taxable income that are based on assumptions that are consistent with our plans and estimates. Should the actual amounts differ from our estimates, the amount of our valuation allowance could be materially impacted. Any adjustment to the deferred tax asset valuation allowance would be recorded in the income statement for the periods in which the adjustment is determined to be required.
We account for uncertainty in income taxes as required by the provisions of ASC Topic 740, Income Taxes, which clarifies the accounting for uncertainty in income taxes recognized in an enterprise’s financial statements. The first step is to evaluate the tax position for recognition by determining if the weight of available evidence indicates that it is more likely than not that the position will be sustained on audit, including resolution of related appeals or litigation processes, if any. The second step is to estimate and measure the tax benefit as the largest amount that is more than 50% likely of being realized upon ultimate settlement. It is inherently difficult and subjective to estimate such amounts, as this requires us to determine the probability of various possible outcomes. We consider many factors when evaluating and estimating our tax positions and tax benefits, which may require periodic adjustments and may not accurately anticipate actual outcomes.
The Tax Reform Act of 1986 and similar state provisions limit the use of net operating loss carryforwards in certain situations where equity transactions result in a change of ownership as defined by Internal Revenue Code Section 382. In the event we should experience an ownership change, as defined, utilization of our federal and state net operating loss carryforwards could be limited.
Results of Operations
Financial Operations Overview
The following table shows the amounts from our consolidated statements of operations as a percentage of total revenues for the periods presented (in thousands):
42
Years Ended December 31, |
% of Total Revenues |
||||||||||||||||||||
2013 |
2012 |
2011 |
2013 |
2012 |
2011 |
||||||||||||||||
Revenues: |
|||||||||||||||||||||
Product revenues |
$ |
20,423 |
$ |
35,924 |
$ |
49,021 |
64 |
% |
40 |
% |
39 |
% |
|||||||||
Collaborative research and development |
6,868 |
49,977 |
70,918 |
22 |
% |
57 |
% |
58 |
% |
||||||||||||
Revenue sharing arrangement |
4,631 |
150 |
450 |
14 |
% |
— |
% |
— |
% |
||||||||||||
Government awards |
— |
2,247 |
3,476 |
— |
% |
3 |
% |
3 |
% |
||||||||||||
Total revenues |
31,922 |
88,298 |
123,865 |
100 |
% |
100 |
% |
100 |
% |
||||||||||||
Costs and operating expenses: |
|||||||||||||||||||||
Cost of product revenues |
14,554 |
30,647 |
41,781 |
46 |
% |
35 |
% |
34 |
% |
||||||||||||
Research and development |
31,606 |
56,785 |
61,049 |
99 |
% |
64 |
% |
49 |
% |
||||||||||||
Selling, general and administrative |
26,908 |
31,379 |
36,942 |
84 |
% |
36 |
% |
30 |
% |
||||||||||||
Total costs and operating expenses |
73,068 |
118,811 |
139,772 |
229 |
% |
135 |
% |
113 |
% |
||||||||||||
Loss from operations |
(41,146 |
) |
(30,513 |
) |
(15,907 |
) |
(129 |
)% |
(35 |
)% |
(13 |
)% |
|||||||||
Interest income |
60 |
252 |
273 |
— |
% |
— |
% |
— |
% |
||||||||||||
Interest expense and other, net |
(304 |
) |
(326 |
) |
(675 |
) |
(1 |
)% |
— |
% |
(1 |
)% |
|||||||||
Loss before income taxes |
(41,390 |
) |
(30,587 |
) |
(16,309 |
) |
(130 |
)% |
(35 |
)% |
(13 |
)% |
|||||||||
Provision for (benefit from) income taxes |
(87 |
) |
270 |
241 |
— |
% |
— |
% |
— |
% |
|||||||||||
Net loss |
$ |
(41,303 |
) |
$ |
(30,857 |
) |
$ |
(16,550 |
) |
(129 |
)% |
(35 |
)% |
(13 |
)% |
||||||
Revenues
Our consolidated net revenue, by revenue type, for each of the three years ended December 31, 2013, 2012 and 2011 are presented in the table below. Also presented is the related dollar and percentage change in consolidated total revenues, as compared with the prior year, for each of the two years ended December 31, 2013 and 2012.
Years Ended December 31, |
||||||||||||
(In Thousands) |
2013 |
2012 |
2011 |
|||||||||
Product revenues |
$ |
20,423 |
$ |
35,924 |
$ |
49,021 |
||||||
Shell Collaborative research and development |
— |
45,321 |
63,179 |
|||||||||
Collaborative research and development |
6,868 |
4,656 |
7,739 |
|||||||||
Revenue sharing arrangement |
4,631 |
150 |
450 |
|||||||||
Government awards |
— |
2,247 |
3,476 |
|||||||||
Total revenues |
$ |
31,922 |
$ |
88,298 |
$ |
123,865 |
||||||
Revenue decrease |
$ |
(56,376 |
) |
$ |
(35,567 |
) |
||||||
Percentage change |
(64 |
)% |
(29 |
)% |
||||||||
Our revenues in 2013 were $31.9 million compared to 2012 revenues of $88.3 million and 2011 revenues of $123.9 million. The decrease in revenues in 2013 is primarily due to the termination of the Shell agreement in 2012. Collaborative research and development revenues received from Shell were $0, $45.3 million and $63.2 million in 2013, 2012 and 2011, respectively, and accounted for 0%, 51% and 51% of our total revenues, respectively, for the same periods.
Our top five customers accounted for 81%, 83%, and 77% of our total revenues in 2013, 2012, and 2011 respectively. Shell accounted for 0%, 51%, and 51% of our total revenues in 2013, 2012, and 2011 respectively. Accounts receivable balances for the top five customers were 80% of total balances as of December 31, 2013 and December 31, 2012.
Fiscal 2013 Compared to Fiscal 2012
Our product sales in 2013 were $20.4 million, compared to 2012 product sales of $35.9 million. Our product sales accounted for 64% and 40% of total revenues in 2013 and 2012, respectively. The decrease in product sales in 2013 as compared to 2012 is primarily due to lower revenues for generic statin-family and hepatitis C products, primarily to India-based generic manufacturers. Statin-family products revenues were $3.4 million and Hepatitis C product revenues were $6.2 million in 2013.
43
In 2012 and 2011, our revenues for generic statin-family based products were higher as customers purchased product in anticipation of the Lipitor patent expiration. In 2012, following patent expiration, pricing for Lipitor generic products dropped due primarily to competition from Chinese manufacturers. To counter this pricing pressure, we signed the New Arch Enzyme Supply Agreement in November 2012 to allow Arch to supply these customers directly, while we supplied enzyme products to Arch. During 2013, Arch was unable to competitively supply statin family products to end customers due to financial difficulties. As a result, our revenues for statin family products decreased by $17.5 million in 2013 compared to 2012. Hepatitis C product revenues decreased $2.9 million in 2013 as a result of decreased demand resulting from newer products entering the market. We do not expect statin family and hepatitis C product revenues to be a significant portion of total revenues in future periods as a result of both unfavorable market pricing and newer products entering the market. Sales of on-patent products to pharmaceutical innovator customers increased by $2.5 million in 2013 to $13.1 million as compared to $10.6 million in 2012, as newer on-patent products utilizing our enzymes were released to the market and began to ramp production. We expect pharmaceutical sales for on-patent products to increase in future periods.
Our collaborative research and development revenues in 2013 were $6.9 million compared to 2012 revenues of $4.6 million. Our collaborative research and development revenues accounted for 22% and 5% of our total revenues in 2013 and 2012, respectively. The increase in collaborative research and development revenues in 2013 was primarily due to higher licensing and royalties revenues.
Our revenue sharing arrangement revenues in 2013 were $4.6 million compared to 2012 revenues of $0.2 million. Our revenue sharing arrangement revenues accounted for 14% in 2013 and less than 1% of our total revenues in 2012. We base our revenue recognition estimates upon notification of revenue share. The increase in revenues was the result of volume shipments of Argatroban and a change from quarterly reporting to monthly reporting of results from our partner, Exela.
We received no governmental awards revenues in 2013 compared to $2.2 million in 2012 as the ARPA-E Recovery Act program for carbon capture technology concluded on June 30, 2012, and our award from the EDB was terminated as a result of closing our Singapore facility in December 2012. As of December 31, 2013, we did not have any government awards from which we expect to receive revenues in future periods.
Fiscal 2012 Compared to Fiscal 2011
Revenues decreased during the year ended December 31, 2012 compared to the year ended December 31, 2011, primarily due to changes in pharmaceutical customer markets as well as the termination of our Shell research agreement.
Product revenues decreased $13.1 million or 27% in 2012 compared to 2011 due to a decrease in product sales to both generic and innovator pharmaceutical customers. Product revenues from our generic statin-family of products decreased by $9.1 million. Our 2011 sales of statin-family of products benefited from generics manufacturers stocking inventory in anticipation of the Lipitor® patent expiration in 2012. Our 2012 sales of statin-family of products were negatively impacted subsequent to the Lipitor patent expiration as pricing for Lipitor generic products dropped more than expected due to competition from Chinese manufacturers.
Additionally, product revenues from our products used in on-patent pharmaceuticals decreased during 2012 compared to 2011 by $4.8 million, comprised of $1.9 million for products used in hepatitis C therapies, $1.6 million for products used in cancer therapies, and $1.3 million for products used in diabetic therapies. The decrease is primarily due to the delay of product orders of our products used in hepatitis C and diabetic therapies from late 2012 to early 2013. Further, the decrease in 2012 for products used in cancer therapies is primarily due to the accelerated manufacturing process development and drug qualification by an innovator pharmaceutical manufacturer in 2011.
Collaborative research and development revenues were $50.1 million for 2012 and consisted of $45.3 million in revenues under the Shell Research Agreement and $4.8 million for collaborative research and development revenues from pharmaceutical customers.
Our collaborative research agreement with Shell terminated effective August 31, 2012 and as a result, our collaborative research and development revenues derived from Shell decreased $17.9 million to $45.3 million in 2012 compared to $63.2 million in 2011. This decrease is also a result of no Shell milestone payments earned during 2012 while $5.6 million were earned during 2011.
Our other collaborative research and development revenues decreased $3.4 million in 2012 compared to 2011 due to a $3.9 million decrease in our revenues from collaborations with Alstom Power Inc. in carbon management which was partially offset by $0.5 million increase in our pharmaceutical collaboration projects in 2012. Our research agreements with customers researching carbon capture technologies were concluded in December 2011. We are no longer actively developing our carbon capture technology and do not expect any revenues from our carbon management program.
44
Government award revenues decreased $1.2 million during 2012 compared to 2011 as our award from the DOE under the ARPA-E Recovery Act program for carbon capture technology concluded on June 30, 2012, and our award from the EDB was terminated as a result of closing our Singapore facility in December 2012. Our award revenue from the DOE was $1.6 million in 2012 compared to $2.2 million 2011. Our award from the EDB was $0.6 million during 2012 compared to $1.3 million in 2011.
Cost of Product Revenues
Cost of product revenues includes both internal and third-party fixed and variable product costs including contract manufacturing costs, materials and supplies, labor, facilities and other overhead costs associated with our product revenues.
Years Ended December 31, |
||||||||||||
(In Thousands) |
2013 |
2012 |
2011 |
|||||||||
Cost of revenues: |
||||||||||||
Product |
$ |
14,554 |
$ |
30,647 |
$ |
41,781 |
||||||
Cost of revenues decrease |
$ |
(16,093 |
) |
$ |
(11,134 |
) |
||||||
Percentage change |
(53 |
)% |
(27 |
)% |
||||||||
Gross profit: |
||||||||||||
Product |
$ |
5,869 |
$ |
5,277 |
$ |
7,240 |
||||||
Product gross margin % |
29 |
% |
15 |
% |
15 |
% |
||||||
Gross profit increase (decrease) |
$ |
592 |
$ |
(1,963 |
) |
|||||||
Percentage change |
11 |
% |
(27 |
)% |
||||||||
Fiscal 2013 Compared to Fiscal 2012
Our cost of product revenues decreased $16.1 million in 2013 compared to 2012 primarily due to the decrease of product revenues related to reduced statin-family product sales primarily to India-based pharmaceutical product generic manufacturers. Our product gross margins improved to 29% in 2013 compared to 15% in 2012. The increase in gross margin percentage is a result of a different mix of product sales in 2013 as gross margins for statin-family product revenues sold in 2012 were below product gross margins for on-patent customers in 2013.
Fiscal 2012 Compared to Fiscal 2011
Our cost of product revenues decreased $11.1 million in 2012 compared to 2011 primarily due to the $13.1 million decrease in our product sales. The decrease in product sales was primarily due to $9.1 million decrease in sales of our statin-family of products to India-based pharmaceutical product generics manufacturers. Additionally, our products used in on-patent pharmaceuticals in hepatitis C therapies, in cancer therapies, and in diabetic therapies, which generally produce greater gross margins, had a combined decrease in product sales of $4.8 million. As a result, our gross margin in 2012 was 15%, the same as for 2011.
Operating Expenses
Years Ended December 31, |
||||||||||||
(In Thousands) |
2013 |
2012 |
2011 |
|||||||||
Research and development |
$ |
31,606 |
$ |
56,785 |
$ |
61,049 |
||||||
Selling, general and administrative |
26,908 |
31,379 |
36,942 |
|||||||||
Total operating expenses |
$ |
58,514 |
$ |
88,164 |
$ |
97,991 |
||||||
Expense decrease |
$ |
(29,650 |
) |
$ |
(9,827 |
) |
||||||
Percentage change |
(34 |
)% |
(10 |
)% |
||||||||
Research and Development Expenses
45
Research and development expenses consist of costs incurred for internal projects as well as partner-funded collaborative research and development activities. These costs include our direct and research-related overhead expenses, which include salaries and other personnel-related expenses (including stock-based compensation), occupancy-related costs, supplies, depreciation of facilities and laboratory equipment and amortization of acquired technologies, as well as research consultants, and are expensed as incurred. Costs to acquire technologies that are utilized in research and development and that have no alternative future use are expensed when incurred.
Fiscal 2013 Compared to Fiscal 2012
Research and development expenses totaled $31.6 million and $56.8 million for the years ended December 31, 2013 and December 31, 2012, respectively. Expenses decreased $25.2 million in 2013 primarily related to restructuring actions we took during the third quarter of 2012 following the termination of the Shell Research Agreement. Our research and development headcount decreased by 17 employees to 82 employees at December 31, 2013 from 99 employees at December 31, 2012. As a result of the cost reduction efforts, we reduced compensation and related costs by $17.0 million, lab supply costs by $2.2 million, and outside services costs by $2.0 million for the year ended December 31, 2013, as compared to the year ended December 31, 2012. Depreciation cost decreased $2.5 million as a result of excess equipment disposed of as part of the restructuring efforts. We reduced facility costs by $1.9 million as a result of closing our Singapore research facility for the year ended December 31, 2013, as compared to the same period of 2012. Research and development expenses included stock-based compensation expense of $1.2 million in 2013 as compared to $2.3 million in 2012. The stock-based compensation expense decrease resulted from cancellation of equity awards related to termination of employees in 2012. Asset impairment charges increased by $1.5 million in 2013 primarily due to the write-down of excess equipment reclassified as assets held for sale as a result of winding down the CodeXol® business.
Fiscal 2012 Compared to Fiscal 2011
Research and development expenses totaled $56.8 million and $61.0 million for the years ended December 31, 2012 and December 31, 2011, respectively. Expenses decreased $4.3 million in 2012 primarily due to a $2.2 million decrease in compensation expenses (including $1.0 million decrease in stock-based compensation) as we significantly decreased headcount in the second half of 2012 following the termination of the Shell Research Agreement. Lab supplies decreased $1.3 million as a result of our reduced headcount from the reduction in force announced in the third quarter of 2012. We reduced our travel costs $0.9 million and our outside services by $0.5 million as a result of the cost reduction measures and the termination of research efforts under the Shell Research Agreement. This was offset by an increase in depreciation costs of $0.9 million as a result of an expansion of lab space that we completed in early 2012. Research and development expenses included stock-based compensation expense of $2.3 million and $3.3 million during 2012 and 2011, respectively. The stock-based compensation expense decrease is attributable to canceled options resulting from the headcount reduction during 2012 and fewer outstanding options compared to 2011.
Selling, General and Administrative Expenses
Selling, general and administrative expenses consist of compensation expenses (including stock-based compensation), hiring and training costs, consulting and service provider expenses (including patent counsel related costs), marketing costs, occupancy-related costs, depreciation and amortization expenses, and travel and relocation expenses.
Fiscal 2013 Compared to Fiscal 2012
Selling, general and administrative expenses totaled $26.9 million and $31.4 million for the years ended December 31, 2013 and December 31, 2012, respectively. Expenses decreased $4.5 million in 2013 primarily due to the restructuring actions taken by us during the third quarter of 2012 following the termination of the Shell Research Agreement. Our selling, general and administrative headcount decreased to 43 employees at December 31, 2013 from 55 employees at December 31, 2012. The decrease in expense of $4.5 million is primarily due to reduced compensation expense and related employee costs of $2.2 million, reduced accounting fees of $0.5 million, and reduced losses on the disposal of fixed assets of $2.2 million as a result of excess equipment disposed of as part of the restructuring efforts for the year ended December 31, 2012. Selling, general and administrative expenses included stock-based compensation expense of $3.2 million in 2013 as compared to $2.7 million in 2012. The stock-based compensation expense increase resulted from the issuance of equity awards to new management employees in 2013.
During 2013, there were no losses recorded for equity investments, as compared to a loss of $0.8 million recorded for the year ended December 31, 2012.
Fiscal 2012 Compared to Fiscal 2011
46
Selling, general and administrative expenses totaled $31.4 million and $36.9 million for the years ended December 31, 2012 and December 31, 2011, respectively. Expenses decreased $5.6 million in 2012 primarily due to a $4.6 million decrease in compensation expenses (including $3.4 million decrease in stock-based compensation) as we significantly decreased headcount in the second half of 2012. Outside services decreased $1.7 million related to decreased consulting costs of $0.9 million, decreased legal costs of $0.5 million and decreased accounting costs of $0.3 million. Our travel costs decreased $0.8 million due to decreased international travel. Selling, general and administrative expenses included stock-based compensation expense of $2.7 million and $6.1 million during 2012 and 2011, respectively. The stock-based compensation expense decrease is attributable to canceled options resulting from the headcount reduction during 2012 and fewer outstanding options compared to 2011.
Restructuring Charges
All Restructuring Plans |
Years Ended December 31, |
|||||||||||
(In Thousands) |
2013 |
2012 |
2011 |
|||||||||
Research and development |
$ |
573 |
$ |
974 |
$ |
— |
||||||
Selling, general and administrative |
210 |
1,982 |
— |
|||||||||
Total restructuring expenses |
$ |
783 |
$ |
2,956 |
$ |
— |
||||||
Restructuring expenses increase (decrease) |
$ |
(2,173 |
) |
$ |
2,956 |
|||||||
During the fourth quarter of 2013, our board of directors approved and committed to a restructuring plan (the "Q4 2013 Restructuring Plan") to reduce our cost structure as a result of the winding down of our CodeXyme® cellulase enzyme program. We recorded restructuring expenses for the Q4 2013 Restructuring Plan of $0.8 million, primarily for employee severance and other termination benefits, consisting of $0.6 million in research and development expenses and $0.2 million in selling, general and administrative expenses. We anticipate the 2013 restructuring will reduce expense in 2014 by approximately $3.4 million in the United States.
During the third quarter of 2012, our board of directors approved and committed to a restructuring plan (the “Q3 2012 Restructuring Plan”) to reduce our cost structure following the termination of the Shell Agreement. Pursuant to the Q3 2012 Restructuring Plan, we terminated 173 employees in the United States and Singapore and closed our Singapore facility. Approximately 150 of the total 173 employee terminations were in research and development while the remaining 23 employees were selling, general and administrative employees.
We estimated Q3 2012 restructuring would reduce expenses in 2013 by $22.1 million and $7.1 million in the United States and Singapore, respectively. For the year ended December 31, 2013, total operating expense decreased $29.7 million, which met our expense reduction targets.
We recorded restructuring expenses for the Q3 2012 Restructuring Plan of $2.4 million, comprised of $1.1 million of leasehold improvement write down, $0.7 million for employee severance and other termination benefits, $0.3 million for facility lease termination costs and $0.3 million for equipment disposal charges. During the year ended December 31, 2012, costs of $1.5 million were recognized in selling, general and administrative expenses and $0.9 million were recognized in research and development on our consolidated statements of operations. We do not anticipate recording any further charges under this restructuring plan.
During the first quarter of 2012, our board of directors approved and committed to a restructuring plan (the “Q1 2012 Restructuring Plan”) to reduce our cost structure, which included a total of 13 employee terminations in Hungary, Singapore, and the United States. We recorded expenses for the Q1 2012 Restructuring Plan of $0.5 million , comprised primarily of employee severance and other termination benefits. During the year ended December 31, 2012, costs of $0.5 million have been recognized in selling, general and administrative expenses on our consolidated statements of operations. We do not anticipate recording any further charges under this restructuring plan.
47
Other Income (Expense), net
Years Ended December 31, |
||||||||||||
(In Thousands) |
2013 |
2012 |
2011 |
|||||||||
Interest income |
$ |
60 |
$ |
252 |
$ |
273 |
||||||
Interest expense and other, net |
(304 |
) |
(326 |
) |
(675 |
) |
||||||
Total other income (expense), net |
$ |
(244 |
) |
$ |
(74 |
) |
$ |
(402 |
) |
|||
Other expense increase (decrease) |
$ |
(170 |
) |
$ |
328 |
|||||||
Percentage change |
(230 |
)% |
82 |
% |
||||||||
Interest Income. Interest income decreased $0.2 million in 2013 compared to 2012 primarily due to decreased balances in our cash, cash equivalents and marketable securities. Interest income decreased slightly due to decreased balances in our cash, cash equivalents and marketable securities in 2012 compared to 2011.
Interest Expense and Other, Net. Interest expense and other, net, decreased slightly in 2013 compared to 2012 due to decreased losses from foreign currency translations primarily related to our operations in Hungary, India and Singapore. Interest expense and other, net, decreased $0.3 million during 2012 compared to 2011 related to decreased losses from foreign currency translations primarily related to our operations in Hungary, India and Singapore.
Provision for Income Taxes
Years Ended December 31, |
||||||||||||
(In Thousands) |
2013 |
2012 |
2011 |
|||||||||
Provision for (benefit from) income taxes |
$ |
(87 |
) |
$ |
270 |
$ |
241 |
|||||
Income taxes increase (decrease) |
$ |
(357 |
) |
$ |
29 |
|||||||
Percentage change |
(132 |
)% |
12 |
% |
||||||||
The tax benefit for 2013 is primarily due to losses in international locations and changes in deferred taxes. The tax provision for 2012 and 2011 primarily consisted of income taxes attributable to foreign operations and expenses related to uncertain tax positions.
Liquidity and Capital Resources
December 31, |
|||||||||||
(In Thousands) |
2013 |
2012 |
2011 |
||||||||
Cash and cash equivalents |
$ |
22,130 |
$ |
32,003 |
$ |
25,762 |
|||||
Marketable securities, short term |
3,005 |
13,524 |
27,720 |
||||||||
Marketable securities, long-term |
795 |
3,623 |
10,348 |
||||||||
Accounts receivable, net |
5,413 |
7,545 |
18,917 |
||||||||
Accounts payable, accrued compensation and accrued liabilities |
9,198 |
14,097 |
24,503 |
||||||||
Working capital |
24,582 |
43,486 |
50,940 |
||||||||
At December 31, 2013, we had $25.9 million of cash, cash equivalents and marketable securities, compared to $49.1 million at December 31, 2012. Working capital, calculated as total current assets less total current liabilities, decreased to $24.6 million at December 31, 2013, compared to $43.5 million at December 31, 2012.
We believe that, based on our current level of operations, our existing cash, cash equivalents and marketable securities will provide adequate funds for ongoing operations, planned capital expenditures and working capital requirements for at least the next 12 months. However, we may need additional capital if our current plans and assumptions change. Our need for additional capital will depend on many factors, including the financial success of our biocatalysis business, our spending to develop and commercialize new and existing products and the amount of collaboration funding we may receive to held cover the cost of such expenditures, the effect of any acquisitions of other businesses, technologies or facilities that we may make or develop in the future, our spending on new market opportunities, including opportunities in the fine chemicals markets, and the filing, prosecution, enforcement and defense of patent claims. If our capital resources are insufficient to meet our capital requirements, and we are unable to enter into or maintain collaborations with partners that are able or willing to fund our development efforts
48
or commercialize any products that we develop or enable, we will have to raise additional funds to continue the development of our technology and products and complete the commercialization of products, if any, resulting from our technologies. If future financings involve the issuance of equity securities, our existing stockholders would suffer dilution. If we raise debt financing, we may be subject to restrictive covenants that limit our ability to conduct our business. We may not be able to raise sufficient additional funds on terms that are favorable to us, if at all. If we fail to raise sufficient funds and fail to generate sufficient revenues to achieve planned gross margins and to control operating costs, our ability to fund our operations, take advantage of strategic opportunities, develop products or technologies, or otherwise respond to competitive pressures could be significantly limited. If this happens, we may be forced to delay or terminate research or development programs or the commercialization of products resulting from our technologies, curtail or cease operations or obtain funds through collaborative and licensing arrangements that may require us to relinquish commercial rights, or grant licenses on terms that are not favorable to us. If adequate funds are not available, we will not be able to successfully execute our business plan or continue our business.
Years Ended December 31, |
||||||||||||
(In Thousands) |
2013 |
2012 |
2011 |
|||||||||
Net cash used in operating activities |
$ |
(22,998 |
) |
$ |
(11,892 |
) |
$ |
(490 |
) |
|||
Net cash provided by/ (used in) investing activities |
13,272 |
16,711 |
(48,808 |
) |
||||||||
Net cash provided by financing activities |
(147 |
) |
1,257 |
2,579 |
||||||||
Effect of exchange rate changes on cash and cash equivalents |
— |
165 |
85 |
|||||||||
Net increase (decrease) in cash and cash equivalents |
$ |
(9,873 |
) |
$ |
6,241 |
$ |
(46,634 |
) |
||||
Cash Flows from Operating Activities
Cash used in operating activities was $23.0 million in 2013, resulting from a net loss of $41.3 million, adjusted for $16.3 million in non-cash charges, and a $2.0 million increase in cash associated with the net change in operating assets and liabilities. The non-cash charges primarily included depreciation and amortization of $10.3 million, stock-based compensation of $4.4 million and asset impairment charges of $1.6 million. The net change in operating assets and liabilities included decreases in accounts receivable of $1.6 million due to lower revenues, increases in deferred revenue of $1.6 million due to a reversal of a prepayment from a customer, as well as decreases in accrued liabilities of $2.7 million primarily due to the settlement of outstanding obligations with Arch.
Our operating activities in 2012 used cash of $11.9 million, primarily due to our net loss of $30.9 million in 2012, adjusted for decreases in our accounts payable of $6.7 million resulting from the timing of our vendor payments and decreases in our accrued compensation expenses of $3.3 million primarily from lower employee-accrued compensation, and increases in prepaid expenses and other current assets of $3.1 million primarily due to advances to our contract manufacturer. These were partially offset by decreases in accounts receivable of $11.4 million primarily due to decreased product revenues and decreases in product inventory of $3.2 million primarily due to the New Arch Enzyme Supply Agreement entered into with Arch in the fourth quarter of 2012. We also had net non-cash charges of $20.6 million, comprised primarily of non-cash share-based compensation expense of $5.1 million and $12.4 million in depreciation and amortization. Additionally, we had non-cash charges of $0.8 million related to an other-than-temporary impairment of our equity investment in CO2 Solutions Inc.("CO2 Solutions"), and $1.6 million in non-cash charges related to the disposal of property and equipment resulting from our restructuring efforts during 2012.
Our operating activities in 2011 used cash of $0.5 million, primarily due to our net loss of $16.6 million in 2011, adjusted for increases in accounts receivable of $3.6 million due to increased product revenues and the timing of payments from Shell and a decrease in deferred revenues of $4.3 million primarily as a result of billings to Shell in a prior period and recognized within revenue during 2011. We also had net non-cash charges of $21.6 million, comprised primarily of non-cash share-based compensation expense of $9.4 million and $11.5 million in depreciation and amortization.
Cash Flows from Investing Activities
In 2013, net cash provided from investing activities totaled $13.3 million and primarily consisted of proceeds from the maturity of marketable securities of $13.4 million and a reduction of restricted cash of $0.8 million, which was partially offset by capital expenditures of $1.2 million.
In 2012, net cash provided by investing activities totaled $16.7 million and primarily consisted of a net decrease in marketable securities of $19.6 million, offset by capital expenditures of $2.9 million primarily related to improvements for our facility expansion and purchase of lab equipment.
49
In 2011, net cash used in investing activities totaled $48.8 million and primarily consisted of a net increase in marketable securities of $38.0 million and capital expenditures of $10.7 million primarily related to improvements for our facility expansion and purchase of research lab equipment.
Cash Flows from Financing Activities
Net cash used in financing activities was $0.1 million for the year ended December 31, 2013, and net cash provided by financing activities was $1.3 million and $2.6 million for the years ended December 31, 2012 and 2011, respectively. In 2013, the cash used in financing activities resulted from taxes paid to net share settlement of equity awards, which was partially offset by proceeds from the exercise of employee stock options. In 2012 and 2011, the cash provided by financing activities resulted from the exercise of employee stock options.
Contractual Obligations and Commitments
The following summarizes the future commitments arising from our contractual obligations at December 31, 2013 (in thousands):
Total |
Less than 1 year |
1 to 3 years |
4 to 5 years |
More than 5 years |
|||||||||||||||
Operating leases |
$ |
17,551 |
$ |
2,968 |
$ |
6,116 |
$ |
5,413 |
$ |
3,054 |
|||||||||
Total |
$ |
17,551 |
$ |
2,968 |
$ |
6,116 |
$ |
5,413 |
$ |
3,054 |
|||||||||
We have excluded from the above table $1.3 million in contractual obligations related to uncertain tax positions as we cannot make a reasonably reliable estimate of the period of cash settlement.
Off-Balance Sheet Arrangements
As of December 31, 2013, we had no off-balance sheet arrangements as defined in Item 303(a)(4) of Regulation S-K as promulgated by the SEC.
Accounting Guidance Update
Recently Adopted Accounting Guidance
In February 2013, the Financial Accounting Standards Board ("FASB") issued ASU 2013-02 related to the reporting of amounts reclassified out of accumulated other comprehensive income that requires entities to report, either on their income statement or in a footnote to their financial statements, the effects on earnings from items that are reclassified out of other comprehensive income. We adopted this accounting standard on January 1, 2013, and the adoption of this guidance did not have a material impact on our financial statements or disclosures.
ITEM 7A. QUANTITATIVE AND QUALITATIVE DISCLOSURES ABOUT MARKET RISK
Interest Rate Sensitivity
We had unrestricted cash and cash equivalents totaling $22.1 million at December 31, 2013. These amounts were invested primarily in money market funds and are held for working capital purposes. We had current and non-current marketable securities holdings of $3.0 million and $0.8 million, respectively. These amounts were invested primarily in corporate bonds,
50
corporate equities and United States government obligations and are held for working capital purposes. We do not enter into investments for trading or speculative purposes. We believe we do not have material exposure to changes in fair value as a result of changes in interest rates. Declines in interest rates, however, will reduce future investment income. If overall interest rates fell by 10% in 2013, our interest income would have declined by approximately $6,000, assuming consistent investment levels.
Foreign Currency Risk
Our operations include manufacturing and sales activities in the United States, Austria, Belgium, France, Germany, Italy, Japan and India, as well as research activities in countries outside the United States, including Hungary. Our results of operations and cash flows are subject to fluctuations due to changes in foreign currency exchange rates. For example, we purchase materials for, and pay employees at, our research facility in Hungary in Hungarian Forint. In addition, we purchase products for sale in the United States from foreign companies and have agreed to pay them in currencies other than the United States dollar. As a result, our expenses and cash flows are subject to fluctuations due to changes in foreign currency exchange rates. In periods when the United States dollar declines in value as compared to the foreign currencies in which we incur expenses, our foreign-currency based expenses increase when translated into United States dollars. Although it is possible to do so, we have not hedged our foreign currency since the exposure has not been material to our historical operating results. Although substantially all of our sales are denominated in United States dollars, future fluctuations in the value of the United States dollar may affect the price competitiveness of our products outside the United States. The effect of a 10% adverse change in exchange rates on foreign denominated receivables as of December 31, 2013 would have had no effect on foreign exchange losses recognized as a component of interest expense and other, net in our consolidated statement of operations. We may consider hedging for our foreign currency risk in the future.
Equity Price Risk
As described further in Note 8 to the consolidated financial statements, we have an investment in common shares of CO2 Solutions Inc., a company based in Quebec City, Canada, or CO2 Solutions, whose shares are publicly traded in Canada on the TSX Venture Exchange. During 2012, we evaluated our investment in the common shares of CO2 Solutions. At the time of the evaluation the fair value of our investment in CO2 Solutions’ common stock was $0.6 million and our carrying cost for the investment was $1.3 million and we determine the impairment was other-than-temporary considering the length of time and extent to which the fair value had been less than our cost, the financial condition and near term prospects of CO2 Solutions, and our management’s ability and intent to hold the securities until fair value recovers. As a result of our analysis, we recorded an impairment of $0.8 million during 2012 as an expense in our consolidated statement of operations as selling, general and administrative expense. As of December 31, 2013, the fair value of our investment in CO2 Solutions’ common stock was $0.8 million with an unrealized gain of $0.2 million.
This investment is exposed to fluctuations in both the market price of CO2 Solutions’ common shares and changes in the exchange rates between the United States dollar and the Canadian dollar. The effect of a 10% adverse change in the market price of CO2 Solutions’ common shares as of December 31, 2013 would have been an unrealized loss of approximately $80,000, recognized as a component of our consolidated statement of comprehensive loss. The effect of a 10% adverse change in the exchange rates between the United States dollar and the Canadian dollar as of December 31, 2013 would have been an unrealized loss of approximately $80,000, recognized as a component of our consolidated statements of comprehensive loss.
51
ITEM 8. FINANCIAL STATEMENTS AND SUPPLEMENTARY DATA
Codexis, Inc.
INDEX TO CONSOLIDATED FINANCIAL STATEMENTS
52
Report of Independent Registered Public Accounting Firm
Board of Directors and Stockholders
Codexis, Inc.
Redwood City, California
We have audited the accompanying consolidated balance sheet of Codexis, Inc. as of December 31, 2013 and the related consolidated statements of operations, comprehensive loss, stockholders’ equity, and cash flows for the year ended December 31, 2013. These financial statements are the responsibility of the Company’s management. Our responsibility is to express an opinion on these financial statements based on our audit.
We conducted our audit in accordance with the standards of the Public Company Accounting Oversight Board (United States). Those standards require that we plan and perform the audit to obtain reasonable assurance about whether the financial statements are free of material misstatement. An audit includes examining, on a test basis, evidence supporting the amounts and disclosures in the financial statements, assessing the accounting principles used and significant estimates made by management, as well as evaluating the overall financial statement presentation. We believe that our audit provides a reasonable basis for our opinion.
In our opinion, the consolidated financial statements referred to above present fairly, in all material respects, the financial position of Codexis, Inc. at December 31, 2013, and the results of its operations and its cash flows for the year ended December 31, 2013, in conformity with accounting principles generally accepted in the United States of America.
We also have audited, in accordance with the standards of the Public Company Accounting Oversight Board (United States), Codexis, Inc.'s internal control over financial reporting as of December 31, 2013, based on criteria established in Internal Control Integrated Framework (1992) issued by the Committee of Sponsoring Organizations of the Treadway Commission (COSO) and our report dated March 12, 2014 expressed an unqualified opinion thereon.
/s/ BDO USA, LLP
San Jose, California
March 12, 2014
53
Report of Independent Registered Public Accounting Firm on Internal Control Over Financial Reporting
The Board of Directors and Stockholders
Codexis, Inc.
Redwood City, California
We have audited Codexis, Inc.’s internal control over financial reporting as of December 31, 2013, based on criteria established in Internal Control - Integrated Framework (1992) issued by the Committee of Sponsoring Organizations of the Treadway Commission (the COSO criteria). Codexis, Inc.’s management is responsible for maintaining effective internal control over financial reporting and for its assessment of the effectiveness of internal control over financial reporting, included in Item 9A, Management’s Report on Internal Control Over Financial Reporting. Our responsibility is to express an opinion on the company’s internal control over financial reporting based on our audit.
We conducted our audit in accordance with the standards of the Public Company Accounting Oversight Board (United States). Those standards require that we plan and perform the audit to obtain reasonable assurance about whether effective internal control over financial reporting was maintained in all material respects. Our audit included obtaining an understanding of internal control over financial reporting, assessing the risk that a material weakness exists, and testing and evaluating the design and operating effectiveness of internal control based on the assessed risk. Our audit also included performing such other procedures as we considered necessary in the circumstances. We believe that our audit provides a reasonable basis for our opinion.
A company’s internal control over financial reporting is a process designed to provide reasonable assurance regarding the reliability of financial reporting and the preparation of financial statements for external purposes in accordance with generally accepted accounting principles. A company’s internal control over financial reporting includes those policies and procedures that (1) pertain to the maintenance of records that, in reasonable detail, accurately and fairly reflect the transactions and dispositions of the assets of the company; (2) provide reasonable assurance that transactions are recorded as necessary to permit preparation of financial statements in accordance with generally accepted accounting principles, and that receipts and expenditures of the company are being made only in accordance with authorizations of management and directors of the company; and (3) provide reasonable assurance regarding prevention or timely detection of unauthorized acquisition, use, or disposition of the company’s assets that could have a material effect on the financial statements.
Because of its inherent limitations, internal control over financial reporting may not prevent or detect misstatements. Also, projections of any evaluation of effectiveness to future periods are subject to the risk that controls may become inadequate because of changes in conditions, or that the degree of compliance with the policies or procedures may deteriorate.
In our opinion, Codexis, Inc. maintained, in all material respects, effective internal control over financial reporting as of December 31, 2013, based on the COSO criteria.
We also have audited, in accordance with the standards of the Public Company Accounting Oversight Board (United States), the consolidated balance sheet of Codexis, Inc. as of December 31, 2013, and the related consolidated statements of operations, comprehensive loss, stockholders’ equity, and cash flows for the year ended December 31, 2013 and our report dated March 12, 2014 expressed an unqualified opinion thereon.
/s/ BDO USA, LLP
San Jose, California
March 12, 2014
54
Report of Independent Registered Public Accounting Firm
The Board of Directors and Stockholders
Codexis, Inc.
We have audited the accompanying consolidated balance sheet of Codexis, Inc. (the Company) as of December 31, 2012, and the related consolidated statements of operations, comprehensive loss and stockholders' equity and cash flows for each of the two years in the period ended December 31, 2012. These financial statements are the responsibility of the Company's management. Our responsibility is to express an opinion on these financial statements based on our audits.
We conducted our audits in accordance with the standards of the Public Company Accounting Oversight Board (United States). Those standards require that we plan and perform the audit to obtain reasonable assurance about whether the financial statements are free of material misstatement. An audit also includes examining, on a test basis, evidence supporting the amounts and disclosures in the financial statements. An audit also includes assessing the accounting principles used and significant estimates made by management, as well as evaluating the overall financial statement presentation. We believe that our audits provide a reasonable basis for our opinion.
In our opinion, the financial statements referred to above present fairly, in all material respects, the consolidated financial position of Codexis, Inc. at December 31, 2012, and the consolidated results of its operations and its cash flows for each of the two years in the period ended December 31, 2012, in conformity with U.S. generally accepted accounting principles.
/s/ Ernst & Young LLP
San Jose, California
April 2, 2013
55
Codexis, Inc.
Consolidated Balance Sheets
(In Thousands, Except Per Share Amounts)
December 31, |
|||||||
2013 |
2012 |
||||||
Assets |
|||||||
Current assets: |
|||||||
Cash and cash equivalents |
$ |
22,130 |
$ |
32,003 |
|||
Marketable securities |
3,005 |
13,524 |
|||||
Accounts receivable, net of allowances of $460 and $150 at December 31, 2013 and 2012, respectively |
5,413 |
7,545 |
|||||
Inventories |
1,487 |
1,302 |
|||||
Prepaid expenses and other current assets |
1,567 |
5,395 |
|||||
Assets held for sale |
2,179 |
— |
|||||
Total current assets |
35,781 |
59,769 |
|||||
Restricted cash |
711 |
1,511 |
|||||
Non-current marketable securities |
795 |
3,623 |
|||||
Property and equipment, net |
8,446 |
16,650 |
|||||
Intangible assets, net |
9,560 |
12,934 |
|||||
Goodwill |
3,241 |
3,241 |
|||||
Other non-current assets |
306 |
2,237 |
|||||
Total assets |
$ |
58,840 |
$ |
99,965 |
|||
Liabilities and Stockholders’ Equity |
|||||||
Current liabilities: |
|||||||
Accounts payable |
$ |
3,961 |
$ |
3,654 |
|||
Accrued compensation |
3,625 |
3,495 |
|||||
Other accrued liabilities |
1,612 |
6,948 |
|||||
Deferred revenues |
2,001 |
2,186 |
|||||
Total current liabilities |
11,199 |
16,283 |
|||||
Deferred revenues, net of current portion |
1,114 |
1,299 |
|||||
Other long-term liabilities |
5,044 |
3,943 |
|||||
Commitments and contingencies |
|||||||
Stockholders’ equity: |
|||||||
Preferred stock, $0.0001 par value per share; 5,000 shares authorized at December 31, 2013 and 2012; None issued and outstanding at December 31, 2013 and 2012; |
— |
— |
|||||
Common stock, $0.0001 par value per share; 100,000 shares authorized at December 31, 2013 and 2012; 38,351 and 37,692 shares issued and outstanding at December 31, 2013 and 2012, respectively; |
4 |
4 |
|||||
Additional paid-in capital |
298,370 |
294,128 |
|||||
Accumulated other comprehensive loss |
(32 |
) |
(136 |
) |
|||
Accumulated deficit |
(256,859 |
) |
(215,556 |
) |
|||
Total stockholders’ equity |
41,483 |
78,440 |
|||||
Total liabilities and stockholders’ equity |
$ |
58,840 |
$ |
99,965 |
|||
See Notes to Consolidated Financial Statements
56
Codexis, Inc.
Consolidated Statements of Operations
(In Thousands, Except Per Share Amounts)
Years Ended December 31, |
|||||||||||
2013 |
2012 |
2011 |
|||||||||
Revenues: |
|||||||||||
Product |
$ |
20,423 |
$ |
35,924 |
$ |
49,021 |
|||||
Collaborative research and development |
6,868 |
49,977 |
70,918 |
||||||||
Revenue sharing arrangement |
4,631 |
150 |
450 |
||||||||
Government awards |
— |
2,247 |
3,476 |
||||||||
Total revenues |
31,922 |
88,298 |
123,865 |
||||||||
Costs and operating expenses: |
|||||||||||
Cost of product revenues |
14,554 |
30,647 |
41,781 |
||||||||
Research and development |
31,606 |
56,785 |
61,049 |
||||||||
Selling, general and administrative |
26,908 |
31,379 |
36,942 |
||||||||
Total costs and operating expenses |
73,068 |
118,811 |
139,772 |
||||||||
Loss from operations |
(41,146 |
) |
(30,513 |
) |
(15,907 |
) |
|||||
Interest income |
60 |
252 |
273 |
||||||||
Interest expense and other, net |
(304 |
) |
(326 |
) |
(675 |
) |
|||||
Loss before income taxes |
(41,390 |
) |
(30,587 |
) |
(16,309 |
) |
|||||
Provision for (benefit from) income taxes |
(87 |
) |
270 |
241 |
|||||||
Net loss |
$ |
(41,303 |
) |
$ |
(30,857 |
) |
$ |
(16,550 |
) |
||
Net loss per share, basic and diluted |
$ |
(1.08 |
) |
$ |
(0.84 |
) |
$ |
(0.46 |
) |
||
Weighted average common shares used in computing net loss per share, basic and diluted |
38,231 |
36,768 |
35,674 |
||||||||
See Notes to Consolidated Financial Statements
57
Codexis, Inc.
Consolidated Statements of Comprehensive Loss
(In Thousands)
Years Ended December 31, |
|||||||||||
2013 |
2012 |
2011 |
|||||||||
Net loss |
$ |
(41,303 |
) |
$ |
(30,857 |
) |
$ |
(16,550 |
) |
||
Other comprehensive income (loss): |
|||||||||||
Foreign currency translation adjustments |
— |
165 |
(3 |
) |
|||||||
Reclassification of other-than-temporary loss in marketable securities included in net loss |
— |
753 |
— |
||||||||
Unrealized gain (loss) on marketable securities, net of tax |
104 |
(647 |
) |
(370 |
) |
||||||
Other comprehensive income (loss) |
104 |
271 |
(373 |
) |
|||||||
Total comprehensive loss |
$ |
(41,199 |
) |
$ |
(30,586 |
) |
$ |
(16,923 |
) |
||
See Notes to Consolidated Financial Statements
58
Codexis, Inc.
Consolidated Statements of Stockholders’ Equity
(In Thousands)
Common Stock |
Additional
Paid-in
Capital
|
Accumulated
Other
Comprehensive
Income (Loss)
|
Accumulated
Deficit
|
Total
Stockholders’
Equity
|
|||||||||||||||||||
Shares |
Amount |
||||||||||||||||||||||
December 31, 2010 |
34,829 |
$ |
4 |
$ |
275,540 |
$ |
(34 |
) |
$ |
(168,149 |
) |
$ |
107,361 |
||||||||||
Exercise of stock options |
1,167 |
— |
2,579 |
— |
— |
2,579 |
|||||||||||||||||
Employee stock-based compensation |
— |
— |
9,286 |
— |
— |
9,286 |
|||||||||||||||||
Non-employee stock-based compensation |
— |
— |
387 |
— |
— |
387 |
|||||||||||||||||
Total comprehensive loss |
— |
— |
— |
(373 |
) |
(16,550 |
) |
(16,923 |
) |
||||||||||||||
December 31, 2011 |
35,996 |
4 |
287,792 |
(407 |
) |
(184,699 |
) |
102,690 |
|||||||||||||||
Exercise of common warrants |
3 |
— |
— |
— |
— |
— |
|||||||||||||||||
Exercise of stock options |
708 |
— |
1,257 |
— |
— |
1,257 |
|||||||||||||||||
Cancellation of shares |
(17 |
) |
— |
(65 |
) |
— |
— |
(65 |
) |
||||||||||||||
Release of stock awards |
982 |
— |
— |
— |
— |
— |
|||||||||||||||||
Employee stock-based compensation |
— |
— |
5,040 |
— |
— |
5,040 |
|||||||||||||||||
Non-employee stock-based compensation |
20 |
— |
104 |
— |
— |
104 |
|||||||||||||||||
Total comprehensive loss |
— |
— |
— |
271 |
(30,857 |
) |
(30,586 |
) |
|||||||||||||||
December 31, 2012 |
37,692 |
4 |
294,128 |
(136 |
) |
(215,556 |
) |
78,440 |
|||||||||||||||
Exercise of stock options |
326 |
— |
318 |
— |
— |
318 |
|||||||||||||||||
Cancellation of shares |
(75 |
) |
— |
(465 |
) |
— |
— |
(465 |
) |
||||||||||||||
Release of stock awards |
408 |
— |
— |
— |
— |
— |
|||||||||||||||||
Employee stock-based compensation |
— |
— |
4,366 |
— |
— |
4,366 |
|||||||||||||||||
Non-employee stock-based compensation |
— |
— |
23 |
— |
— |
23 |
|||||||||||||||||
Total comprehensive loss |
— |
— |
— |
104 |
(41,303 |
) |
(41,199 |
) |
|||||||||||||||
December 31, 2013 |
38,351 |
$ |
4 |
$ |
298,370 |
$ |
(32 |
) |
$ |
(256,859 |
) |
$ |
41,483 |
||||||||||
See Notes to Consolidated Financial Statements
59
Codexis, Inc.
Consolidated Statements of Cash Flows
(In Thousands)
Years Ended December 31, |
|||||||||||
2013 |
2012 |
2011 |
|||||||||
Operating activities: |
|||||||||||
Net loss |
$ |
(41,303 |
) |
$ |
(30,857 |
) |
$ |
(16,550 |
) |
||
Adjustments to reconcile net loss to net cash used in operating activities: |
|||||||||||
Amortization of intangible assets |
3,374 |
3,509 |
3,716 |
||||||||
Depreciation and amortization of property and equipment |
6,944 |
8,908 |
7,755 |
||||||||
Loss on impairment and disposal of property and equipment |
1,582 |
1,551 |
49 |
||||||||
Impairment of marketable securities |
— |
753 |
— |
||||||||
Gain from extinguishment of asset retirement obligation |
— |
(212 |
) |
(124 |
) |
||||||
Stock-based compensation |
4,389 |
5,076 |
9,431 |
||||||||
Common stock issuances for royalty payment to a licensor |
— |
68 |
— |
||||||||
Accretion of asset retirement obligation |
— |
30 |
39 |
||||||||
Accretion of premium on marketable securities |
42 |
697 |
771 |
||||||||
Changes in operating assets and liabilities: |
|||||||||||
Accounts receivable |
1,629 |
11,372 |
(3,583 |
) |
|||||||
Inventories |
(185 |
) |
3,186 |
(1,671 |
) |
||||||
Prepaid expenses and other current assets |
850 |
(3,051 |
) |
(682 |
) |
||||||
Other assets |
337 |
(1,330 |
) |
513 |
|||||||
Accounts payable |
308 |
(6,710 |
) |
1,156 |
|||||||
Accrued compensation |
130 |
(3,290 |
) |
(1,322 |
) |
||||||
Other accrued liabilities |
(2,724 |
) |
197 |
4,351 |
|||||||
Deferred revenues |
1,629 |
(1,789 |
) |
(4,339 |
) |
||||||
Net cash used in operating activities |
(22,998 |
) |
(11,892 |
) |
(490 |
) |
|||||
Investing activities: |
|||||||||||
Decrease (increase) in restricted cash |
800 |
— |
(45 |
) |
|||||||
Purchase of property and equipment |
(1,175 |
) |
(2,933 |
) |
(10,736 |
) |
|||||
Purchase of marketable securities |
— |
(20,638 |
) |
(52,564 |
) |
||||||
Proceeds from sale of marketable securities |
— |
10,397 |
6,037 |
||||||||
Proceeds from maturities of marketable securities |
13,409 |
29,885 |
8,500 |
||||||||
Proceeds from disposal of property and equipment |
238 |
— |
— |
||||||||
Net cash provided by (used in) investing activities |
13,272 |
16,711 |
(48,808 |
) |
|||||||
Financing activities: |
|||||||||||
Proceeds from exercises of stock options |
318 |
1,257 |
2,579 |
||||||||
Taxes paid related to net share settlement of equity awards |
(465 |
) |
— |
— |
|||||||
Net cash provided by (used in) financing activities |
(147 |
) |
1,257 |
2,579 |
|||||||
Effect of exchange rate changes on cash and cash equivalents |
— |
165 |
85 |
||||||||
Net increase (decrease) in cash and cash equivalents |
(9,873 |
) |
6,241 |
(46,634 |
) |
||||||
Cash and cash equivalents at the beginning of the year |
32,003 |
25,762 |
72,396 |
||||||||
Cash and cash equivalents at the end of the year |
$ |
22,130 |
$ |
32,003 |
$ |
25,762 |
|||||
Supplemental disclosures of cash flow information: |
|||||||||||
Cash paid for income taxes |
$ |
103 |
$ |
126 |
$ |
89 |
|||||
Long term deposit in other assets transferred to property and equipment |
$ |
1,857 |
$ |
— |
$ |
— |
|||||
Equipment in property and equipment transferred to assets held for sale |
$ |
2,179 |
$ |
— |
$ |
— |
|||||
See Notes to Consolidated Financial Statements
60
Codexis, Inc.
Notes to Consolidated Financial Statements
1. Description of Business
Codexis, Inc. (the “Company”) was incorporated in the State of Delaware in January 2002. The Company develops biocatalysts for the pharmaceutical and fine chemicals markets. Its proven technologies enable scale-up and implementation of biocatalytic solutions to meet customer needs for rapid, cost-effective and sustainable process development, from research to manufacturing.
Biocatalysts are enzymes or microbes that initiate and/or accelerate chemical reactions. Manufacturers have historically used naturally occurring biocatalysts to produce many goods used in everyday life. However, inherent limitations in naturally occurring biocatalysts have restricted their commercial use. The Company’s proprietary technology platform is able to overcome many of these limitations, allowing us to evolve and optimize biocatalysts to perform specific and desired chemical reactions at commercial scale.
The Company has commercialized its technology and products in the pharmaceuticals market, which is the Company’s primary business focus. The Company’s pharmaceutical customers, which include several of the largest global pharmaceutical companies, use the Company’s technology, products and services in their manufacturing process development, including in the production of some of the world's bestselling and fastest growing drugs.
The Company has recently begun to use its technology to develop biocatalysts for use in the fine chemicals markets. The fine chemicals market is similar to the Company’s pharmaceutical business and consists of several large market segments, including food, animal feed, polymers, flavors and fragrances and agricultural chemicals, and so it is a natural fit for the Company’s technology.
The Company creates its products by applying its CodeEvolver® directed evolution technology platform, which introduces genetic mutations into microorganisms, giving rise to changes in the enzymes that they produce. Once the Company identifies potentially beneficial mutations, it tests combinations of these mutations until it has created variant enzymes that exhibit marketable performance characteristics superior to competitive products. This process allows the Company to make continuous, efficient improvements to the performance of its enzymes.
In these Notes to Consolidated Financial Statements, the “Company” refers to Codexis, Inc. and its subsidiaries on a consolidated basis.
2. Summary of Significant Accounting Policies
Basis of Presentation and Consolidation
The consolidated financial statements have been prepared in accordance with accounting principles generally accepted in the United States of America (“GAAP”) and the applicable rules and regulations of the Securities and Exchange Commission (“SEC”) and include the accounts of Codexis, Inc. and its wholly-owned subsidiaries. The Company has subsidiaries in the United States, Brazil, Hungary, India, Mauritius, The Netherlands and Singapore. All significant intercompany balances and transactions have been eliminated in consolidation.
Significant Risks and Uncertainties
The Company incurred net losses of $41.3 million, $30.9 million and $16.6 million for the years ended December 31, 2013, 2012 and 2011, respectively. The Company used $23.0 million, $11.9 million and $0.5 million of cash in operating activities for the years ended December 31, 2013, 2012 and 2011, respectively. At December 31, 2013, the Company had an accumulated deficit of $256.9 million and unrestricted cash and cash equivalents of $22.1 million. The Company may be required to seek additional funds through collaborations or public or private debt or equity financings, and may also seek to reduce expenses related to its operations. There can be no assurance that any financing will be available or at terms acceptable to us.
Use of Estimates
The preparation of consolidated financial statements in conformity with GAAP requires management to make estimates and assumptions that affect the reported amounts of assets and liabilities, disclosures of contingent liabilities at the date of the consolidated financial statements, and the reported amounts of revenues and expenses during the reporting period. The Company's management regularly assesses these estimates which primarily affect revenue recognition, the valuation of marketable securities and accounts receivable, intangible assets, goodwill arising out of business acquisitions, inventories,
61
accrued liabilities, stock awards and the valuation allowances associated with deferred tax assets. Actual results could differ from those estimates and such differences may be material to the consolidated financial statements.
Concentrations of Credit Risk/Major Customers
Financial instruments that potentially subject us to significant concentrations of credit risk consist primarily of cash and cash equivalents, marketable securities, accounts receivable and restricted cash. Cash and cash equivalents, marketable securities and restricted cash are invested through banks and other financial institutions in the United States, as well as in other foreign countries. Such deposits may be in excess of insured limits.
Credit risk with respect to accounts receivable exists to the full extent of amounts presented in the consolidated financial statements. The Company periodically requires collateral to support credit sales. The Company estimates an allowance for doubtful accounts through specific identification of potentially uncollectible accounts receivable based on an analysis of its accounts receivable aging. Uncollectible accounts receivable are written off against the allowance for doubtful accounts when all efforts to collect them have been exhausted. Recoveries are recognized when they are received. Actual collection losses may differ from the Company's estimates and could be material to the Company's consolidated financial position, results of operations, and cash flows.
The Company's top five customers accounted for 81% and 83% of the Company's total revenues for the twelve months ended December 31, 2013 and 2012, respectively.
Customers with revenues of 10% or more of the Company's total revenues consist of the following:
|
Percentage of Total Revenues
For The Years Ended December 31,
|
||||||||
2013 |
2012 |
2011 |
||||||
Customers: |
||||||||
Merck |
39 |
% |
13 |
% |
10 |
% |
||
Exela |
15 |
% |
— |
% |
— |
% |
||
Novartis |
14 |
% |
1 |
% |
1 |
% |
||
Shell |
— |
% |
51 |
% |
51 |
% |
||
Novartis had a balance of 50% of the Company's accounts receivable as of December 31, 2013. Merck had a balance of 53% and Novartis had a balance of 11% of the Company’s accounts receivable as of December 31, 2012.
During 2013, the Company recorded an allowance for bad debt of approximately $387,000 due to a write-off of an accounts receivable from Arch Pharmalabs Limited ("Arch").
Cash, Cash Equivalents and Marketable Securities
The Company considers all highly liquid investments with maturity dates of three months or less at the date of purchase to be cash equivalents. Cash and cash equivalents consist of cash on deposit with banks and money market funds. The majority of cash and cash equivalents are maintained with major financial institutions in North America. Deposits with these financial institutions may exceed the amount of insurance provided on such deposits. Marketable securities included in current assets are comprised of corporate bonds, commercial paper, government-sponsored enterprise securities and United States Treasury obligations. Marketable securities included in non-current assets are comprised of corporate bonds and United States Treasury obligations that have a maturity date greater than 1 year. The Company's investment in common shares of CO2 Solutions Inc. (“CO2 Solutions”) is included in non-current marketable securities.
The Company performs separate evaluations of impaired debt and equity securities to determine if the unrealized losses as of the balance sheet date are other-than-temporary impairment.
For the Company's investments in equity securities, its evaluation considers a number of factors including, but not limited to, the length of time and extent to which the fair value has been less than cost, the financial condition and near term prospects of the issuer, and its management’s ability and intent to hold the securities until fair value recovers. The assessment of the ability and intent to hold these securities to recovery focuses on the Company's current and forecasted liquidity requirements and its capital requirements. Based on the Company's evaluation, the Company concluded during the third quarter of 2012, the unrealized losses related to its equity investment in the common shares of CO2 Solutions were deemed to be other-than-temporary and as a result, the Company recorded a $753,000 impairment charge in its consolidated statement of operations (see Note 8). As of December 31, 2013, there were no unrealized losses related to the Company's equity securities.
62
For the Company's investments in debt securities, the Company's management determines whether it intends to sell or if it is more-likely-than-not that it will be required to sell impaired securities. This determination considers the Company's current and forecasted liquidity requirements, its capital requirements and securities portfolio objectives. For all impaired debt securities for which there was no intent or expected requirement to sell, the evaluation considers all available evidence to assess whether it is likely the amortized cost value will be recovered. The Company conducts a regular assessment of its debt securities with unrealized losses to determine whether the securities have other-than-temporary impairment considering, among other factors, the nature of the securities, credit rating or financial condition of the issuer, the extent and duration of the unrealized loss, expected cash flows of underlying collateral and market conditions. As of December 31, 2013, there were no unrealized losses related to the Company's debt securities.
The Company's investments in debt and equity securities are classified as available-for-sale and are carried at estimated fair value. Unrealized gains and losses are reported on the consolidated statement of comprehensive loss unless considered other-than-temporary. Amortization of purchase premiums and accretion of purchase discounts, realized gains and losses of debt securities and declines in value deemed to be other-than-temporary, if any, are included in interest income or interest expense and other, net. The cost of securities sold is based on the specific-identification method. There were no significant realized gains or losses from sales of marketable securities during the years ended December 31, 2013, 2012, and 2011.
Fair Value of Financial Instruments
The carrying amounts of certain of the Company's financial instruments, including cash and cash equivalents, restricted cash, accounts receivable, accounts payable, accrued compensation and other accrued liabilities approximate fair value due to their short maturities.
Fair value is considered to be the price at which an asset could be exchanged or a liability transferred (an exit price) in an orderly transaction between knowledgeable, willing parties in the principal or most advantageous market for the asset or liability. Where available, fair value is based on or derived from observable market prices or other observable inputs. Where observable prices or inputs are not available, valuation models are applied. These valuation techniques involve some level of management estimation and judgment, the degree of which is dependent on the price transparency for the instruments and the instruments’ complexity.
Accounts Receivable
Accounts receivable represent amounts owed to the Company under its collaborative research and development agreements, product revenues and government awards. The Company records trade accounts receivable at invoiced amounts and maintains a valuation allowance for doubtful accounts.
The following is a summary of activity in the Company's allowance for doubtful accounts for the three years ended December 31, 2013, 2012 and 2011 (in thousands):
Years ended December 31, |
||||||||||||
2013 |
2012 |
2011 |
||||||||||
Allowance - beginning of period |
$ |
(150 |
) |
$ |
(17 |
) |
$ |
(58 |
) |
|||
Provisions for doubtful accounts |
(386 |
) |
(133 |
) |
41 |
|||||||
Recoveries from bad debts |
76 |
— |
— |
|||||||||
Write-off and other |
— |
— |
— |
|||||||||
Allowance - end of period |
$ |
(460 |
) |
$ |
(150 |
) |
$ |
(17 |
) |
|||
Inventories
Inventories consist of biocatalysts and pharmaceutical intermediates. Internally produced biocatalysts only qualify as commercial inventory after they have achieved specifications that are required for selling the materials. Inventories held at the Company's contract manufacturers are accepted as finished goods after achieving specifications stated in its purchase orders. Inventories are carried at the lower of cost or market. Cost is determined using the first-in first-out method or the specific identification method depending on location. Inventories, based on demand and age, are written down as excess and obsolete materials, if necessary.
Prepaid Expenses and Other Current Assets
63
Included in prepaid expenses and other current assets as of December 31, 2012 was $1,100,000 in deferred cost of sales related to a sales arrangement with a customer that was deferred due to extended payment terms. Payment was received in 2013 and recorded in cost of sales.
Restricted Cash
Restricted cash consisted of amounts invested in money market accounts primarily for purposes of securing a standby letter of credit as collateral for the Company's Redwood City, California facility lease agreement. During the year ended December 31, 2013, restricted cash decreased by $800,000 due to the termination of the Company's working capital line of credit. Restricted cash was unchanged during the year ended December 31, 2012.
Property and Equipment
Property and equipment, including the cost of purchased software, are stated at cost, less accumulated depreciation and amortization. Property and equipment also includes equipment that has been received but not yet placed in service. Normal repairs and maintenance costs are expensed as incurred. Depreciation is calculated using the straight-line method over the following estimated ranges of useful lives:
Asset classification |
Estimated useful life |
|
Laboratory equipment |
5 years |
|
Computer equipment and software |
3 to 5 years |
|
Office equipment and furniture |
5 years |
|
Leasehold improvements |
Lesser of useful life or lease term |
|
Assets Held for Sale
The Company reclassifies long-lived assets to Assets Held for Sale when all required criteria for such reclassification are met. The assets are recorded at the lower of the carrying value or fair value less costs to sell. Assets held for sale must meet the following conditions: (1) management, having authority to approve the action, commits to a plan to sell the asset, (2) the asset is available for immediate sale in its present condition, (3) an active program to locate a buyer and other actions required to complete the plan to sell the asset have been initiated, (4) the sale of the asset is probable, and transfer of the asset is expected to qualify for recognition as a completed sale, within one year, (5) the asset is being actively marketed for sale at a price that is reasonable in relation to its current fair value, and (6) actions required to complete the plan indicate that it is unlikely that significant changes to the plan will be made or that the plan will be withdrawn.
In determining the fair value of the assets less cost to sell, the Company considered factors including current sales prices for comparable assets, recent market analysis studies, appraisals and any recent legitimate offers. If the estimated fair value less cost to sell of an asset is less than its current carrying value, the asset is written down to its estimated fair value less cost to sell. The carrying value of assets, net of the impairment write-off, held for sale was $2,179,000 at December 31, 2013 (see Note 5). All these assets continue to be actively marketed for sale at December 31, 2013. Due to uncertainties in the estimation process, it is reasonably possible that actual results could differ from the estimates used in the Company's historical analyses. The assumptions about equipment sales prices require significant judgment related to equipment condition and certain selling costs. The Company calculated the estimated fair values of assets held for sale based on current market conditions and assumptions made by management, which may differ from actual results and may result in additional impairments if market conditions deteriorate.
Impairment of Long-Lived Assets and Intangible Assets
Long-lived and intangible assets with finite lives are reviewed for impairment whenever events or changes in circumstances indicate the carrying amount of an asset may not be recoverable. Recoverability of these assets is measured by comparison of their carrying amounts to future undiscounted cash flows the assets are expected to generate.
The Company's intangible assets with finite lives consist of customer relationships, developed core technology, trade names, and the intellectual property (“IP”) rights associated with the acquisition of Maxygen Inc.'s ("Maxygen") directed evolution technology in 2010. Intangible assets were recorded at their fair values at the date the Company acquired the assets and, for those assets having finite useful lives, are amortized using the straight-line method over their estimated useful lives. The Company's long-lived assets include property, plant and equipment, and other non-current assets.
64
The Company determined that it has a single entity wide asset group (“Asset Group”). The directed evolution technology patent portfolio acquired from Maxygen (“Core IP”) is the most significant component of the Asset Group since it is the base technology for all aspects of its research and development, and represents the basis for all of the Company's identifiable cash flow generating capacity. Consequently, the Company does not believe that identification of independent cash flows associated with its long-lived assets is currently possible at any lower level than the Asset Group.
The Core IP is the only finite-lived intangible asset on the Company's consolidated balance sheet as of December 31, 2013 and is considered the primary asset within the Asset Group. There has been no significant change in the utilization or estimated life of the Company's Core IP since the Company acquired the technology patent portfolio from Maxygen. The estimated remaining useful life of the Company's Core IP is not impacted by the termination of the Shell Research Agreement or its winding down of its CodeXyme® cellulase enzyme program.
The carrying value of the Company's long-lived assets in the Asset Group may not be recoverable based upon the existence of one or more indicators of impairment which could include: a significant decrease in the market price of the Company's common stock; current period cash flow losses or operating losses combined with a history of losses or a forecast of continuing losses associated with the use of the assets; slower growth rates in the Company's industry; significant adverse changes in the business climate or legal factors; accumulation of costs significantly in excess of the amount originally expected for the acquisition or construction of the assets; loss of significant customers or partners; or the current expectation that the assets will more likely than not be sold or disposed of significantly before the end of their estimated useful life.
The Company evaluates recoverability of its long-lived assets and intangible assets based on the sum of the undiscounted cash flows expected to result from the use, and the eventual disposal of, the Asset Group. The Company makes estimates and judgments about the future undiscounted cash flows over the remaining useful life of the Asset Group. The Company's anticipated future cash flows include its estimates of existing or in process product revenues, production and operating costs, future capital expenditures, working capital needs, and assumptions regarding the ultimate sale of the Asset Group at the end of the life of the primary asset. The useful life of the Asset Group was based on the estimated useful life of the Core IP, the primary asset at the time of acquisition. There has been no change in the estimated useful life of the Asset Group. Although the Company's cash flow forecasts are based on assumptions that are consistent with our plans, there is significant judgment involved in determining the cash flows attributable to the Asset Group over its estimated remaining useful life.
2012 Analysis
As of December 31, 2012 the Company determined that its continued operating losses and the termination of the Shell Research Agreement were indications of impairment.
As a result, in 2012 the Company performed the recoverability test and calculated estimated cashflows through the remaining period of the estimated useful life of the Core IP. The undiscounted cash flows included revenue and expense from the Company's biocatalyst business, both from the pharmaceuticals market and from enzyme markets adjacent to its business in the pharmaceuticals market, including fine chemicals markets.
The Company typically receives revenues from the pharmaceuticals market and expect to receive revenues from other enzyme markets adjacent to its pharmaceutical business in the form of one or more of the following: up-front payments, milestone payments, payments based upon the number of FTEs engaged in related research and development activities and licensing fees and royalties. The Company's best estimate of future cash flows did not include any CodeXol® and CodeXyme® revenues associated with collaboration research and development agreements, but did include an estimate of cash flows from potential strategic transactions with respect to its CodeXyme® and CodeXol® programs, as described below.
In the Company's 2012 impairment analysis, approximately 69% and 31% of total Company revenues included in the estimated undiscounted cash flows (excluding cash flows from potential strategic transactions with respect to the Company's CodeXyme® and CodeXol® programs) over the remaining useful life of the Core IP were derived from the pharmaceuticals market and from adjacent enzyme market opportunities, respectively.
The Company's pharmaceuticals revenues were estimated based on existing commercial relationships, signed agreements or contracts, and conservative estimates for the capture of additional market share that management determined to be reasonably achievable. For existing and in process customer revenues the Company assumed a modest rate of growth based on its historical business model for the Company's core pharmaceutical business, including research and development services revenue from partners and customers, which management determined to be reasonably achievable. The Company has historically worked closely with its pharmaceutical partners to evolve, engineer and develop enzymes that meet their specific needs. The Company's business model is based on having its partners and customers pay in whole or in part for the research and development required to engineer the enzymes required.
65
In determining which adjacent enzyme markets to exploit, management assessed various segments of the large and growing enzyme markets and selected those adjacent markets where the Company already had entry points through its existing pharmaceutical business relationships, such as fine chemicals markets. Estimated revenues associated with these adjacent markets were based on market penetration and adoption rates that management determined to be reasonably achievable.
The expected residual value was determined by applying a Gordon Growth Model to normalized net cash flows using a discount rate of 18.0% (“Estimated Weighted-Average Cost of Capital”) and a long term growth rate of 2%. The 18.0% discount rate reflects the nature and the risk of the underlying forecast, and includes such financial components as the risk free rate, systemic stock price risk based on an evaluation with peer companies (“beta”), equity risk premium, size premium, and company specific risk. The long term growth rate of 2% reflects projected inflation and general economic conditions. Based on the results obtained, the Company determined there was no impairment of its intangible assets as of December 31, 2012.
The Company also included in the undiscounted cash flows an estimate of cash flows from potential strategic transactions with respect to the Company's existing CodeXyme® cellulase enzymes and CodeXol® detergent alcohol programs. The amount of estimated cash flows related to CodeXol® and CodeXyme® represented 38% of the total undiscounted cash flows associated with the Asset Group. These amounts were not based on any existing contracts or agreements.
The results of the Company's fourth quarter 2012 impairment analysis indicated that the undiscounted cash flows for the Asset Group were greater than the carrying value of the Asset Group by approximately 14%. Based on the results obtained, the Company determined there was no impairment of the Company's intangible assets as of December 31, 2012.
2013 Analysis
In the fourth quarter of 2013, the Company determined that its continued annual operating losses and a decline in market price of the Company’s common stock, reduced anticipated future cashflows related to potential CodeXyme® cellulase enzyme and CodeXol® detergent alcohols transactions and reduced future revenue growth to reflect the Company’s most recent outlook were indicators of impairment.
As a result, in the fourth quarter of 2013 the Company performed the recoverability test and calculated estimated cashflows through the remaining period of the estimated useful life of the Core IP. The undiscounted cash flows included revenue and expense from the Company's biocatalyst business, both from the pharmaceuticals market and from enzyme markets adjacent to its business in the pharmaceuticals market, including fine chemicals markets.
The methodology employed in the Company's 2013 analysis was consistent with that used in the Company's impairment analysis performed as of December 31, 2012, although certain assumptions changed in 2013 based on new developments, including reduced anticipated future cashflows related to potential strategic transactions with respect to the Company's CodeXyme® and CodeXol® programs, and reduced future revenue growth to reflect the Company’s most recent outlook and an increase in the Company's fine chemicals activities.
In the Company's 2013 impairment analysis, approximately 90% and 10% of total Company revenues included in its estimated undiscounted cash flows (excluding cash flows from potential strategic transactions with respect to its CodeXyme® and CodeXol® programs) through the estimated useful life of the Core IP were derived from the pharmaceuticals market and from adjacent enzyme market opportunities, respectively.
The expected residual value was determined by applying a Gordon Growth Model to normalized net cash flows using a discount rate of 19.5% (“Estimated Weighted-Average Cost of Capital”) and a long term growth rate of 2%. The 19.5% discount rate reflects the nature and the risk of the underlying forecast, and includes such financial components as the risk free rate, systemic stock price risk based on an evaluation with peer companies (“beta”), equity risk premium, size premium, and Company specific risk. The long term growth rate of 2% reflects projected inflation and general economic conditions.
The Company also included in the undiscounted cash flows an estimate of cash flows from potential strategic transactions with respect to the Company’s CodeXyme® cellulase enzymes and CodeXol® detergent alcohol programs. The amount of estimated cash flows related to CodeXol® and CodeXyme® represented 7% of the total undiscounted cash flows associated with the Asset Group. These amounts are not based on any existing contracts or agreements.
The results of the Company's fourth quarter 2013 impairment analysis indicated that the undiscounted cash flows for the Asset Group were greater than the carrying value of the Asset Group by approximately 37%. Based on the results obtained, the Company determined there was no impairment of the Company's intangible assets as of December 31, 2013.
Although the Company's analysis indicated that the estimated future undiscounted cash flows exceeded the carrying value of the Asset Group, the Company performed a supplemental analysis to determine the fair value of the Core IP. In determining the fair value, the Company prepared cash flow forecasts over the remaining economic life of the Core IP consistent with the time
66
period for final patent expiration from the Maxygen patent portfolio. The Company utilized the multi-period Excess Earnings model and obtained key financial inputs from a review of market participants, Company specific factors and generally accepted valuation methods. The Company utilized a discount rate of 19.5% which reflects the nature and the risk of the underlying forecast and includes other financial components. Based on these estimates, judgments and factors, the Company has determined that the fair value of the Core IP exceeded its carrying value by 44% as of December 31, 2013.
Valuation of Goodwill
The Company reviews goodwill impairment annually in the fourth quarter of each of its fiscal years and whenever events or changes in circumstances indicate the carrying value of goodwill may not be recoverable.
The Company determined that it has only one operating segment and reporting unit under the criteria in ASC 280, Segment Reporting. Accordingly, the Company's review of goodwill impairment indicators is performed at the Company level.
The goodwill impairment test consists of a two-step process. The first step of the goodwill impairment test, used to identify potential impairment, compares the fair value of the reporting unit to its carrying value. If the fair value of the reporting unit exceeds its carrying amount, goodwill of the reporting unit is considered not impaired, and the second step of the impairment test is not required.
The Company uses its market capitalization as an indicator of fair value. The Company believes that since its reporting unit is publicly traded, the ability of a controlling shareholder to benefit from synergies and other intangible assets that arise from control might cause the fair value of the Company's reporting unit as a whole to exceed its market capitalization. However, the Company believes that the fair value measurement need not be based solely on the quoted market price of an individual share of the Company's common stock, but also can consider the impact of a control premium in measuring the fair value of its reporting unit.
If the Company were to use an income approach it would establish a fair value by estimating the present value of its projected future cash flows expected to be generated from its business. The discount rate applied to the projected future cash flows to arrive at the present value would be intended to reflect all risks of ownership and the associated risks of realizing the stream of projected future cash flows. the Company's discounted cash flow methodology would consider projections of financial performance for a period of several years combined with an estimated residual value. The most significant assumptions it would use in a discounted cash flow methodology are the discount rate, the residual value and expected future revenues, gross margins and operating costs, along with considering any implied control premium.
Should the Company's market capitalization be less than the total stockholder's equity as of the Company's annual test date or as of any interim impairment testing date, the Company would also consider market comparables, recent trends in the Company's stock price over a reasonable period and, if appropriate, use an income approach to determine whether the fair value of its reporting unit is greater than the carrying amount.
The second step, if required, compares the implied fair value of the reporting unit goodwill with the carrying amount of that goodwill. If the carrying amount of the reporting unit's goodwill exceeds its implied fair value, an impairment charge is recognized in an amount equal to that excess. Implied fair value is the excess of the fair value of the reporting unit over the fair value of all identified assets and liabilities. The Company bases its fair value estimates on assumptions it believes to be reasonable. Actual future results may differ from those estimates.
Goodwill was tested for impairment in the fourth quarter of 2013. The Company concluded that the fair value of the reporting unit exceeded the carrying value and no impairment existed. No impairment charges were recorded during the years ended December 31, 2013, 2012 and 2011.
Revenue Recognition
Revenues are recognized when the four basic revenue recognition criteria are met: (1) persuasive evidence of an arrangement exists; (2) products have been delivered, transfer of technology has been completed or services have been rendered; (3) the fee is fixed or determinable; and (4) collectability is reasonably assured.
The Company's primary sources of revenues consist of product revenues, collaborative research and development agreements, revenue sharing arrangements and government awards. Collaborative research and development agreements typically provide the Company with multiple revenue streams, including up-front fees for licensing, exclusivity and technology access, fees for full time employee ("FTE") services and the potential to earn milestone payments upon achievement of contractual criteria and royalty fees based on future product sales or cost savings by the Company's customers.
67
For each source of collaborative research and development revenues, product revenues and award revenues, the Company applies the following revenue recognition criteria:
Product revenues are recognized once passage of title and risk of loss has occurred and contractually specified acceptance criteria, if any, have been met, provided all other revenue recognition criteria have also been met. Product revenues consist of sales of biocatalysts, intermediates, active pharmaceutical ingredients and Codex Biocatalyst Panels and Kits. Cost of product revenues includes both internal and third party fixed and variable costs including amortization of purchased technology, materials and supplies, labor, facilities and other overhead costs associated with the Company's product revenues.
Revenue sharing arrangement revenues are recognized based upon sales of licensed products by the Company's revenue share partner Exela (see Note 9 "Related Party Transactions"). Revenue share amounts received are net of product and selling costs. The Company bases its estimates of earned revenue on notification from its revenue share partner of the Company’s share of net profit based on the contractual percentage from the sale of licensed product. The Company bases its estimates on notification of the sale of revenue sharing products and related costs by its revenue share partner.
Up-front fees received in connection with collaborative research and development agreements, including license fees, technology access fees, and exclusivity fees, are deferred upon receipt, are not considered a separate unit of accounting and are recognized as revenues over the relevant performance periods related to the combined units of accounting appropriate for each customer arrangement.
Revenues related to FTE services recognized as research services are performed over the related performance periods for each contract. The Company is required to perform research and development activities as specified in each respective agreement. The payments received are not refundable and are based on a contractual reimbursement rate per FTE working on the project. When up-front payments are combined with FTE services in a single unit of accounting, the Company recognizes the up-front payments using the proportionate performance method of revenue recognition based upon the actual amount of research and development labor hours incurred relative to the amount of the total expected labor hours to be incurred by the Company, up to the amount of cash received. In cases where the planned levels of research services fluctuate substantially over the research term, the Company is required to make estimates of the total hours required to perform the Company's obligations. Research and development expenses related to FTE services under the collaborative research and development agreements approximate the research funding over the term of the respective agreements.
A payment that is contingent upon the achievement of a substantive milestone is recognized in its entirety in the period in which the milestone is achieved. A milestone is an event (i) that can only be achieved based in whole or in part on either the Company's performance or on the occurrence of a specific outcome resulting from its performance, (ii) for which there is substantive uncertainty at the date the arrangement is entered into that the event will be achieved, and (iii) results in additional payments being due to the Company. Milestones are considered substantive when the consideration earned from the achievement of the milestone (i) is commensurate with either the Company's performance to achieve the milestone or the enhancement of value of the item delivered as a result of a specific outcome resulting from its performance, (ii) relates solely to past performance, and (iii) is reasonable relative to all deliverable and payment terms in the arrangement.
Other payments received for which such payments are contingent solely upon the passage of time or the result of a collaborative partner’s performance are recognized as revenue when earned in accordance with the contract terms and when such payments can be reasonably estimated and collectability is reasonably assured.
The Company recognizes revenues from royalties based on licensees’ sales of products using the Company's technologies. Royalties are recognized as earned in accordance with the contract terms when royalties from licensees can be reasonably estimated and collectability is reasonably assured. The Company bases its estimates on notification the sale of licensed products from licensees.
Through 2012, the Company received payments from government entities for work performed in the form of government awards. Government awards are agreements that generally provide the Company with cost reimbursement for certain types of expenditures in return for research and development activities over a contractually defined period. Revenues from government awards are recognized in the period during which the related costs are incurred, provided that the conditions under which the government awards were provided have been met and the Company has only perfunctory obligations outstanding.
Shipping and handling costs charged to customers are recorded as revenues. Shipping costs are included in the Company's cost of product revenues. Such charges were not significant in any of the periods presented.
Concentrations of Supply Risk
68
The Company relies on a limited number of suppliers for its products. The Company believes that other vendors would be able to provide similar products; however, the qualification of such vendors may require substantial start-up time. In order to mitigate any adverse impacts from a disruption of supply, the Company attempts to maintain an adequate supply of critical single-sourced materials. For certain materials, the Company's vendors maintain a supply for the Company. The Company outsources the commercial scale manufacturing of its products to contract manufacturers with facilities in Austria, India and Italy.
Research and Development Expenses
Research and development expenses consist of costs incurred for internal projects as well as partner-funded collaborative research and development activities. These costs include direct and research-related overhead expenses, which include salaries, stock-based compensation and other personnel-related expenses, facility costs, supplies, depreciation of facilities and laboratory equipment, as well as research consultants and the cost of funding research at universities and other research institutions, and are expensed as incurred. Costs to acquire technologies that are utilized in research and development that have no alternative future use, are expensed when incurred.
Advertising
Advertising costs are expensed as incurred and included in selling, general and administrative expenses in the consolidated statements of operations. Advertising costs were $513,000, $351,000, and $113,000 for the years ended December 31, 2013, 2012, and 2011, respectively.
Foreign Currency Translation
The assets and liabilities of foreign subsidiaries, where the local currency is the functional currency, are translated from their respective functional currencies into United States dollars at the exchange rates in effect at the balance sheet date, with resulting foreign currency translation adjustments recorded in the consolidated statement of comprehensive loss. Revenue and expense amounts are translated at average rates during the period.
Where the United States dollar is the functional currency, nonmonetary assets and liabilities originally acquired or assumed in other currencies are recorded in United States dollars at the exchange rates in effect at the date they were acquired or assumed. Monetary assets and liabilities denominated in other currencies are translated into United States dollars at the exchange rates in effect at the balance sheet date. Translation adjustments are recorded in interest expense and other, net in the accompanying consolidated statements of operations. Gains and losses realized from transactions, including intercompany balances not considered as permanent investments, denominated in currencies other than an entity’s functional currency, are included in interest expense and other, net in the accompanying consolidated statements of operations.
Income Taxes
The Company uses the liability method of accounting for income taxes, whereby deferred tax assets or liability account balances are calculated at the balance sheet date using current tax laws and rates in effect for the year in which the differences are expected to affect taxable income. Valuation allowances are provided when necessary to reduce deferred tax assets to the amount that will more likely than not be realized.
The Company makes certain estimates and judgments in determining income tax expense for financial statement purposes. These estimates and judgments occur in the calculation of tax credits, benefits and deductions and in the calculation of certain tax assets and liabilities, which arise from differences in the timing of recognition of revenues and expenses for tax and financial statement purposes. Significant changes to these estimates may result in an increase or decrease to the Company's tax provision in a subsequent period.
In assessing the realizability of deferred tax assets, the Company considers whether it is more likely than not that some portion or all of the deferred tax assets will be realized on a jurisdiction by jurisdiction basis. The ultimate realization of deferred tax assets is dependent upon the generation of taxable income in the future. The Company has recorded a deferred tax asset in jurisdictions where ultimate realization of deferred tax assets is more likely than not to occur.
The Company makes estimates and judgments about its future taxable income that are based on assumptions that are consistent with its plans and estimates. Should the actual amounts differ from its estimates, the amount of its valuation allowance could be materially impacted. Any adjustment to the deferred tax asset valuation allowance would be recorded in the income statement for the periods in which the adjustment is determined to be required.
The Company accounts for uncertainty in income taxes as required by the provisions of ASC Topic 740, Income Taxes, which clarifies the accounting for uncertainty in income taxes recognized in an enterprise’s financial statements. The first step is to
69
evaluate the tax position for recognition by determining if the weight of available evidence indicates that it is more likely than not that the position will be sustained on audit, including resolution of related appeals or litigation processes, if any. The second step is to estimate and measure the tax benefit as the largest amount that is more than 50% likely of being realized upon ultimate settlement. It is inherently difficult and subjective to estimate such amounts, as this requires us to determine the probability of various possible outcomes. The Company considers many factors when evaluating and estimating the Company's tax positions and tax benefits, which may require periodic adjustments and may not accurately anticipate actual outcomes.
The Tax Reform Act of 1986 and similar state provisions limit the use of net operating loss carryforwards in certain situations where equity transactions result in a change of ownership as defined by Internal Revenue Code Section 382. In the event the Company should experience an ownership change, as defined, utilization of the Company's federal and state net operating loss carryforwards could be limited.
Stock-Based Compensation
The fair value of stock options is estimated at grant date using the Black-Scholes option pricing model. The Company’s determination of fair value of stock options on the date of grant, using an option pricing model, is affected by the Company’s stock price, as well as the assumptions regarding a number of highly complex and subjective variables. These variables include, but are not limited to, the Company’s expected stock price volatility over the term of the awards and projected employee stock option exercise behaviors. The fair value of each restricted stock unit grant, each restricted stock award unit and each performance stock unit grant is based on the underlying value of the Company’s common stock on the date of grant. In addition, the Company estimates the expected forfeiture rate and only recognizes expense for those awards expected to vest. The Company estimates the forfeiture rate based on historical experience and to the extent the actual forfeiture rate is different from the estimate, share-based compensation expense is adjusted accordingly. The Company generally uses the straight-line method to allocate stock-based compensation expense to the appropriate reporting periods. Some awards are accounted for using the accelerated method as appropriate for the terms of the awards.
The Company accounts for stock awards issued to non-employees based on their estimated fair value determined using the Black-Scholes option-pricing model. Compensation expense for the stock awards granted to non-employees is recognized based on the fair value of awards as they vest, during the period the related services are rendered.
Net Loss per Share of Common Stock
Basic net loss per share of common stock is computed by dividing the net loss by the weighted-average number of shares of common stock outstanding during the period, less the weighted-average unvested common stock subject to repurchase. Diluted net loss per share of common stock is computed by giving effect to all potential common shares, consisting of stock options, restricted stock units, performance stock units and warrants , to the extent dilutive. Basic and diluted net loss per share of common stock was the same for each period presented as the inclusion of all potential common shares outstanding was anti-dilutive.
The following table presents the calculation of basic and diluted net loss per share of common stock (in thousands, except per share amounts):
Years Ended December 31, |
|||||||||||
2013 |
2012 |
2011 |
|||||||||
Numerator: |
|||||||||||
Net loss |
$ |
(41,303 |
) |
$ |
(30,857 |
) |
$ |
(16,550 |
) |
||
Denominator: |
|||||||||||
Weighted-average shares of common stock outstanding |
38,231 |
36,768 |
35,674 |
||||||||
Weighted-average shares of common stock used in computing net loss per share, basic and diluted |
38,231 |
36,768 |
35,674 |
||||||||
Net loss per share, basic and diluted |
$ |
(1.08 |
) |
$ |
(0.84 |
) |
$ |
(0.46 |
) |
||
The following options to purchase common stock, restricted stock units, performance stock units and warrants to purchase common stock were excluded from the computation of diluted net loss per share of common stock for the periods presented because including them would have had an anti-dilutive effect (in thousands):
70
Years Ended December 31, |
||||||||
2013 |
2012 |
2011 |
||||||
Options to purchase common stock |
4,126 |
6,133 |
7,904 |
|||||
Restricted stock units |
2,238 |
958 |
546 |
|||||
Performance stock units |
358 |
— |
— |
|||||
Warrants to purchase common stock |
75 |
260 |
266 |
|||||
Total |
6,797 |
7,351 |
8,716 |
|||||
Restructuring Costs
The Company applies applicable accounting guidance on accounting for costs associated with restructuring costs, including exit or disposal activities, which requires that a liability for costs associated with an exit or disposal activity be recognized and measured initially at fair value when the liability is incurred. The Company's restructuring activities have primarily been related to severance, benefits and related personnel costs and facility closing costs. The Company determines the facility accrual based on expected cash payments, under the applicable facility lease, reduced by any estimated sublease rental income for such facility (see Note 17).
Reclassifications
From time to time the Company reclassifies certain prior period balances to conform to the current year presentation. These include revenue amounts reclassified and split out into additional categories. These reclassifications had no material impact on previously reported total assets, total liabilities, stockholders’ equity, results of operations or cash flows.
Accounting Guidance Update
Recently Adopted Accounting Guidance
In February 2013, the Financial Accounting Standards Board ("FASB") issued ASU 2013-02 related to the reporting of amounts reclassified out of accumulated other comprehensive income that requires entities to report, either on their income statement or in a footnote to their financial statements, the effects on earnings from items that are reclassified out of other comprehensive income. The Company adopted this accounting standard on January 1, 2013, and the adoption of this guidance did not have a material impact on the Company's financial statements or disclosures.
3. Collaborative Research and Development Agreements
Shell and Raízen
In November 2006, the Company entered into a collaborative research agreement and a license agreement with Shell to develop biocatalysts and associated processes that use such biocatalysts. In November 2007, the Company entered into a new and expanded five-year collaborative research agreement (“Shell Research Agreement”) and a license agreement (the “Shell License Agreement”) with Shell.
In September 2012, the Company entered into an agreement with Shell (the “New Shell Agreement”) which among other things, terminated the Shell Research Agreement effective as of August 31, 2012, except for certain provisions of the Shell Research Agreement which will survive such termination, including provisions regarding intellectual property rights, patent prosecution and maintenance, confidentiality and indemnification. The New Shell Agreement required Shell to pay the Company approximately $7,500,000 as full, complete and final satisfaction of amounts that Shell may have owed the Company under the Shell Research Agreement with respect to (i) FTEs assigned to the Shell Research Agreement and (ii) milestones achieved or achievable by us under the Shell Research Agreement. The $7,500,000 was recognized as revenue during the third quarter of 2012 when all of the Company's obligations were fulfilled under the New Shell Agreement and was collected during the fourth quarter of 2012.
Beginning September 1, 2012, the Company has no further obligations to Shell under the Shell Research Agreement to provide any FTEs to perform work under or after the collaboration and Shell has no future obligations to us under the Shell Research Agreement to provide funding for FTEs to perform work under or after the collaboration. The Company remains eligible to receive a one-time $3,000,000 payment from Shell under the Shell Research Agreement upon the first sale by Shell of a product in the field of converting cellulosic biomass into fermentable sugars in Brazil, or in the fields of converting fermentable sugars derived from biomass into liquid fuel or liquid fuel additives or into lubricants.
71
Under the New Shell Agreement, Shell granted the Company royalty-bearing, non-exclusive rights and licenses to develop, manufacture, use and sell enzymes and microbes in the field of converting cellulosic biomass into fermentable sugars on a worldwide basis, except for Brazil, where such sugars are converted into liquid fuels, fuel additives or lubricants (the “Field of Use”). Raízen holds the exclusive rights to use the Company's enzymes and microbes for converting cellulosic biomass into fermentable sugars in Brazil, where such sugars are converted into ethanol. Following the date on which the Company's biocatalysts are used to produce sugars used in the Field of Use sufficient to produce 30.0 million gallons of liquid fuel, the Company will be required to pay Shell a royalty on the Company's sales to third parties of the Company's enzymes and microbes in the Field of Use, equal to a low single-digit percentage of net sales and the Company will also be required to pay Shell a royalty on the Company's use of biocatalysts in the Field of Use, equal to a low single-digit percentage of its applicable net sales of such enzymes or microbes. Shell is also entitled to discounted pricing under the New Shell Agreement for biocatalysts purchased from the Company by Shell for use in the Field of Use, but the Company is under no obligation to sell such biocatalysts to Shell.
Under the New Shell Agreement, the Company also granted to Shell a non-exclusive, royalty-free license to manufacture, use and import, solely for the use of Shell and its affiliates, (i) enzymes developed by the Company during the ten year period following August 31, 2012 outside of the Shell Research Agreement for use in the Field of Use and (ii) improvements to any microbe developed by the Company during the ten year period following August 31, 2012 outside of the Shell Research Agreement that is derivative of an identified microbe for use in the Field of Use. Shell remains subject to existing royalty obligations to us for future sales of products covered by the intellectual property and technology that remain exclusively licensed to Shell under the License Agreement.
Additionally, with respect to each invention relating to technology or materials regarding novel liquid fuel compounds, liquid fuel additives or lubricants, Shell will continue to be required to work exclusively with the Company, for a period of three years after the first nonprovisional patent application filing for such invention, to identify biological methods of synthesis of the compound(s) that are claimed, or whose use as a liquid fuel compound, additive or lubricant, is claimed, in such patent filing.
The New Shell Agreement has a term that commences on August 31, 2012 and continues until the later of August 31, 2032 or the date of the last to expire patent rights included in the Company's collaboration that claim a biocatalyst or a microbe for use in the Field of Use.
In June 2011, Shell completed the transfer of all of its equity interests in us to Raízen, Shell’s joint venture with Cosan S.A. Indústria e Comércio, (“Cosan”) in Brazil. As a result, Shell is no longer considered a related party. Notwithstanding the above, Shell did not transfer the Shell Research Agreement to Raízen. Additionally, in September 2011, the Company entered into a joint development agreement directly with Raízen. Work under this joint development agreement was completed in 2012 and the Company does not expect this project to continue.
Merck Research and Development Collaboration
On February 1, 2012, the Company entered into a 5 year Sitagliptin Catalyst Supply Agreement ("Sitagliptin Agreement") whereby Merck Sharp and Dohme Corp. ("Merck") may obtain commercial scale substance for their use in the manufacture of one of its products, Januvia®. Merck may extend the term of the Sitagliptin Agreement for an additional five years at its sole discretion.
The Sitagliptin Agreement calls for Merck to pay an annual license fee for the rights to the Sitagliptin technology each year for the term of the Sitagliptin Agreement. As of December 31, 2013, the Company has a deferred revenue balance of $696,000 from Merck related to the license fee. The license fee is being recognized as collaborative research and development revenue ratably over the five year term of the Sitagliptin Agreement. During the twelve months ended December 31, 2013, the Company recognized $1,804,000 of the license fee as collaborative research and development revenue and $1,004,000 in product revenue. Pursuant to the Sitagliptin Agreement, Merck may purchase substance from the Company for a fee based on contractually stated prices. No revenue was recognized under the Sitagliptin Agreement during the twelve months ended December 31, 2012.
Arch Manufacturing Collaboration
From 2006 through November 2012, Arch of Mumbai, India manufactured substantially all of the Company's commercialized intermediates and APIs for sale to generic and innovator pharmaceutical manufacturers. Prior to November 2012, Arch produced atorva-family API's and intermediates for the Company and it sold these directly to end customers primarily in India. In November 2012, the Company entered into a new commercial arrangement with Arch (the "New Arch Enzyme Supply Agreement") whereby it will supply Arch with enzymes for use in the manufacture of atorva family products and Arch will market these products directly to end customers. During 2013, Arch was unable to competitively supply these products to end customers, resulting in a significant decrease in revenues. For the twelve months ended December 31, 2013, the Company
72
recognized $2,134,000 in product revenue for the sale of enzyme inventory to Arch pursuant to the New Arch Enzyme Supply Agreement. During 2013, the Company recorded an allowance for bad debt of approximately $387,000 due to a write-off of an accounts receivable from Arch.
4. Joint Development Agreement with CO2 Solutions
On December 15, 2009, the Company entered into an exclusive joint development agreement with CO2 Solutions, a company based in Quebec City, Quebec, Canada, whose shares are publicly traded in Canada on TSX Venture Exchange. The joint development agreement expired in January 2011. In January 2011, the Company extended its joint development agreement with CO2 Solutions on essentially the same terms as the original agreement. This exclusive arrangement expired in February 2013 and has not been extended.
Under the agreement, the Company obtained a research license to CO2 Solutions’s intellectual property and agreed to conduct research and development activities jointly with CO2 Solutions with the goal of advancing the development of carbon management technology. The Company also purchased 10,000,000 common shares (approximately 16.6% of the total common shares outstanding at the time of investment) of CO2 Solutions in a private placement subject to a four-month statutory resale restriction. This restriction expired on April 15, 2010. The Company concluded that it did not have the ability to exercise significant influence over CO2 Solutions’ operating and financial policies through December 31, 2013.
The Company’s investment in CO2 Solutions is classified as available for sale and is recorded at its fair value. During the year ended December 31, 2012 the Company recorded an impairment charge of $753,000, as the decline in the fair value of the investment was deemed to be other-than-temporary.
5. Assets Held for Sale
In the fourth quarter of 2013, the Company announced that it would begin winding down its CodeXyme® cellulase enzymes program. As a result of the termination of these research programs and corresponding reductions in headcount, the Company has concluded that certain excess research and development equipment is no longer held in use, and these assets were determined to meet the criteria to be classified as held for sale at December 31, 2013. The Company intends to sell the excess assets in an orderly manner, is conducting a program to actively market these assets and believes it will complete the sale within one year.
The Company performed a detailed review of its excess research and development equipment with the assistance of a third party and determined that the estimated net sales price, less selling costs, is below the carrying value. The net carrying value of the excess research and development equipment totaled $3,750,000 and was reduced to an adjusted carrying value of $2,179,000 as of December 31, 2013 to reflect the estimated current fair value for these assets. A charge of $1,571,000 was recorded in the fourth quarter of 2013 to research and development expenses to reduce the value of held for sale assets to their estimated fair market value net of selling expenses. Any changes in the estimated net sale price prior to the sale of the asset will be recognized upon identification of changes in fair value. The Company reclassified the adjusted carrying value to Assets Held for Sale as of December 31, 2013.
Total assets reclassified as Assets Held for Sale at December 31, 2013 along with the related expense to reduce carrying value to fair value were (in thousands):
Held for Sale Assets |
Net Carrying Value |
Impairment Charge |
Adjusted Carrying Value |
|||||||||
Excess research & development equipment |
$ |
3,750 |
$ |
1,571 |
$ |
2,179 |
||||||
6. Balance Sheets and Statements of Operations Details
Inventories
Inventories, net consisted of the following (in thousands):
December 31, |
|||||||
2013 |
2012 |
||||||
Raw materials |
$ |
763 |
$ |
588 |
|||
Work in process |
31 |
52 |
|||||
Finished goods |
693 |
662 |
|||||
Total inventories |
$ |
1,487 |
$ |
1,302 |
|||
73
Property and Equipment, net
Property and equipment consisted of the following (in thousands):
December 31, |
|||||||
2013 |
2012 |
||||||
Laboratory equipment |
$ |
23,949 |
$ |
33,776 |
|||
Leasehold improvements |
9,493 |
4,388 |
|||||
Computer equipment and software |
3,196 |
11,099 |
|||||
Office equipment and furniture |
1,228 |
1,531 |
|||||
Construction in progress (1) |
41 |
28 |
|||||
37,907 |
50,822 |
||||||
Less: accumulated depreciation and amortization |
(29,461 |
) |
(34,172 |
) |
|||
Property and equipment, net |
$ |
8,446 |
$ |
16,650 |
|||
(1) |
Construction in progress includes equipment received but not yet placed into service pending installation. |
Intangible Assets
Intangible assets consisted of the following (in thousands):
December 31, 2013 |
December 31, 2012 |
||||||||||||||||||||||||
|
Gross
Carrying
Amount
|
Accumulated
Amortization
|
Net
Carrying
Amount
|
Gross
Carrying
Amount
|
Accumulated
Amortization
|
Net
Carrying
Amount
|
Weighted-
Average
Amortization
Period
|
|||||||||||||||||||
(years) |
|||||||||||||||||||||||||
Customer relationships |
$ |
3,098 |
$ |
(3,098 |
) |
$ |
— |
$ |
3,098 |
$ |
(3,098 |
) |
$ |
— |
5 |
||||||||||
Developed and core technology |
1,534 |
(1,534 |
) |
— |
1,534 |
(1,534 |
) |
— |
5 |
||||||||||||||||
Maxygen intellectual property |
20,244 |
(10,684 |
) |
9,560 |
20,244 |
(7,310 |
) |
12,934 |
6 |
||||||||||||||||
Total |
$ |
24,876 |
$ |
(15,316 |
) |
$ |
9,560 |
$ |
24,876 |
$ |
(11,942 |
) |
$ |
12,934 |
6 |
||||||||||
The estimated future amortization expense to be charged to research and development through the year ending December 31, 2016 is as follows (in thousands):
Year ending December 31: |
Total |
||
2014 |
$ |
3,374 |
|
2015 |
3,374 |
||
2016 |
2,812 |
||
$ |
9,560 |
||
Goodwill
There were no changes in the carrying value of goodwill of $3,241,000 during 2013 and 2012.
Interest Expense and Other, Net
Interest expense and other, net consisted of the following (in thousands):
74
Years Ended December 31, |
|||||||||||
2013 |
2012 |
2011 |
|||||||||
Interest expense |
$ |
13 |
$ |
— |
$ |
— |
|||||
Foreign exchange losses |
305 |
348 |
706 |
||||||||
Other |
(14 |
) |
(22 |
) |
(31 |
) |
|||||
Interest expense and other, net |
$ |
304 |
$ |
326 |
$ |
675 |
|||||
7. Cash Equivalents, Marketable Securities and Other Investments
At December 31, 2013, cash equivalents, marketable securities and other investments consisted of the following (in thousands):
December 31, 2013 |
|||||||||||||||||
Adjusted Cost |
Gross
Unrealized
Gains
|
Gross
Unrealized
Losses
|
Estimated
Fair Value
|
Average
Contractual
Maturities
|
|||||||||||||
(in days) |
|||||||||||||||||
Money market funds |
$ |
16,089 |
$ |
— |
$ |
— |
$ |
16,089 |
n/a |
||||||||
Corporate bonds |
1,002 |
3 |
— |
1,005 |
140 |
||||||||||||
U.S. Treasury obligations |
2,000 |
— |
— |
2,000 |
59 |
||||||||||||
Common shares of CO2 Solutions
|
563 |
232 |
— |
795 |
n/a |
||||||||||||
Total |
$ |
19,654 |
$ |
235 |
$ |
— |
$ |
19,889 |
|||||||||
The total cash and cash equivalents balance of $22,130,000 as of December 31, 2013 was comprised of money market funds of $16,089,000 and cash of $6,041,000 held with major financial institutions worldwide. At December 31, 2013, the Company had no marketable security in an unrealized loss position.
At December 31, 2012, cash equivalents, marketable securities and other investments consisted of the following (in thousands):
December 31, 2012 |
|||||||||||||||||
Adjusted Cost |
Gross
Unrealized
Gains
|
Gross
Unrealized
Losses
|
Estimated
Fair Value
|
Average
Contractual
Maturities
|
|||||||||||||
(in days) |
|||||||||||||||||
Money market funds |
$ |
24,789 |
$ |
— |
$ |
— |
$ |
24,789 |
n/a |
||||||||
Commercial paper |
1,499 |
1 |
— |
1,500 |
70 |
||||||||||||
Corporate bonds |
9,512 |
10 |
— |
9,522 |
156 |
||||||||||||
U.S. Treasury obligations |
5,511 |
5 |
— |
5,516 |
262 |
||||||||||||
Common shares of CO2 Solutions |
563 |
47 |
— |
610 |
n/a |
||||||||||||
Total |
$ |
41,874 |
$ |
63 |
$ |
— |
$ |
41,937 |
|||||||||
The total cash and cash equivalents balance of $32,003,000 as of December 31, 2012 was comprised of money market funds of $24,789,000 and $7,214,000 held as cash primarily with major financial institutions in North America. At December 31, 2012, the Company had no marketable security in an unrealized loss position.
8. Fair Value
Assets and liabilities recorded at fair value in the consolidated financial statements are categorized based upon the level of judgment associated with the inputs used to measure their fair value. Hierarchical levels which are directly related to the amount of subjectivity associated with the inputs to the valuation of these assets or liabilities are as follows:
Level 1 — Inputs that are unadjusted, quoted prices in active markets for identical assets or liabilities at the measurement date.
Level 2 — Inputs (other than quoted prices included in Level 1) that are either directly or indirectly observable for the asset or liability through correlation with market data at the measurement date and for the duration of the instrument’s anticipated life.
75
Level 3 — Unobservable inputs that are supported by little or no market activity and that are significant to the fair value of the assets or liabilities and which reflect management’s best estimate of what market participants would use in pricing the asset or liability at the measurement date.
For Level 2 financial investments, the Company's investment advisor provides the Company with monthly account statements documenting the value of each investment based on prices received from an independent third-party valuation service provider. This third party evaluates the types of securities in the Company's investment portfolio and calculates a fair value using a multi-dimensional pricing model that includes a variety of inputs, including quoted prices for similar assets and liabilities in active markets, quoted prices for identical or similar assets or liabilities in markets that are not active, interest rates and yield curves observable at commonly quoted intervals, volatilities, prepayment speeds, loss severities, credit risks and default rates that are observable at commonly quoted intervals. As the Company is ultimately responsible for the determination of the fair value of these instruments, the Company performs quarterly analyses using prices obtained from another independent provider of financial instrument valuations, to validate that the prices the Company has used are reasonable estimates of fair value.
Fair Value of Financial Instruments
The following table presents the Company's financial instruments that were measured at fair value on a recurring basis at December 31, 2013 by level within the fair value hierarchy (in thousands):
December 31, 2013 |
|||||||||||||||
Level 1 |
Level 2 |
Level 3 |
Total |
||||||||||||
Financial Assets |
|||||||||||||||
Money market funds |
$ |
16,089 |
$ |
— |
$ |
— |
$ |
16,089 |
|||||||
Corporate bonds |
— |
1,005 |
— |
1,005 |
|||||||||||
U.S. Treasury obligations |
— |
2,000 |
— |
2,000 |
|||||||||||
Common shares of CO2 Solutions |
795 |
— |
795 |
||||||||||||
Total |
$ |
16,089 |
$ |
3,800 |
$ |
— |
$ |
19,889 |
|||||||
The following table presents the Company's financial instruments that were measured at fair value on a recurring basis at December 31, 2012 by level within the fair value hierarchy (in thousands):
December 31, 2012 |
|||||||||||||||
Level 1 |
Level 2 |
Level 3 |
Total |
||||||||||||
Financial Assets |
|||||||||||||||
Money market funds |
$ |
24,789 |
$ |
— |
$ |
— |
$ |
24,789 |
|||||||
Commercial paper |
— |
1,500 |
— |
1,500 |
|||||||||||
Corporate bonds |
— |
9,522 |
— |
9,522 |
|||||||||||
U.S. Treasury obligations |
— |
5,516 |
— |
5,516 |
|||||||||||
Common shares of CO2 Solutions |
610 |
— |
— |
610 |
|||||||||||
Total |
$ |
25,399 |
$ |
16,538 |
$ |
— |
$ |
41,937 |
|||||||
The Company estimated the fair value of its investment in 10,000,000 common shares of CO2 Solutions using the market value of common shares as determined by trading on the TSX Venture Exchange. These securities have been reclassified to Level 2 at December 31, 2013 after further analysis of the fair value inputs available for this investment. The Company believes the fair value inputs do not meet all of the criteria for Level 1 classification primarily due to the low trading volume of the stock in 2013. As of December 31, 2013, the fair value of the Company's investment in CO2 Solutions’ common stock was $795,000 with an unrealized gain of $232,000. During 2012, the Company evaluated its investment in the common shares of CO2 Solutions and determined the impairment was other-than-temporary considering the length of time and extent to which the fair value has been less than its cost, the financial condition and near term prospects of CO2 Solutions, and its management’s ability and intent to hold the securities until fair value recovers. As a result of the above analysis, the Company recorded an impairment of $756,000 during the year ended December 31, 2012 as an expense in its consolidated statement of operations as selling, general and administrative expense. At December 31, 2012, the estimated fair value of its investment in CO2 Solutions' common stock was $610,000 and the unrealized gain was $47,000.
76
The unrealized gain for the years ended December 31, 2013 and 2012, is reflected on the consolidated statements of comprehensive loss, net of a related tax expense of $66,000 and $69,000, respectively.
Fair Value of Assets Held for Sale
As of December 31, 2013, we had assets held for sale of $2,179,000 related to lab equipment located in the Unites States and Hungary. The fair value of these assets was determined based on Level 3 inputs, primarily sales data for similar properties. Losses recognized in fiscal year 2013 due to fair value remeasurements using Level 3 inputs were $1,571,000. The fair value of assets held for sale at December 31, 2013, measured on a nonrecurring basis, is as follows (in thousands):
|
Level 1
Inputs
|
Level 2
Inputs
|
Level 3
Inputs
|
|||||||||
Assets held for sale |
$ |
— |
$ |
— |
$ |
2,179 |
|||||
9. Related Party Transactions
Shell and Raízen
As discussed in Note 3, “Collaborative Research and Development Agreements,” Shell transferred full ownership of the Company's common stock to Raízen, Shell’s joint venture with Cosan S.A., ("Cosan"), in Brazil, in June 2011. Upon Shell’s transfer of ownership interest to Raízen in 2011, Raízen owned 5.6 million shares of the Company's common stock. In July 2011, the Company appointed Pedro Mizutani to the Board of Directors. Mr. Mizutani also serves as the Chief Operating Officer of Raízen S.A. and other affiliated companies as well as a director of Cosan. There were no related party transactions with either Raízen or Cosan for the years ended December 31, 2013, 2012 and 2011.
Exela PharmaSci, Inc.
The Company signed a license agreement with Exela PharmaSci, Inc. (“Exela”) in 2007. A member of the Company's board of directors is also on the board of directors of Exela. Under the terms of the agreement, Exela agreed to pay to the Company a contractual percentage share of Exela’s net profit from the sales of licensed products.
During the years ended December 31, 2013, 2012 and 2011, the Company recognized $4,631,000, $150,000 and $450,000 of revenue, respectively, related to this arrangement, shown in the Company's consolidated statement of operations as revenue sharing arrangement. As of December 31, 2013, the Company had $445,000 owed from Exela and as of December 31, 2012, the Company had no receivables from Exela.
Alexander A. Karsner
Alexander A. Karsner is a director of Codexis and provided consulting services to the Company during 2011, 2012 and 2013. Mr. Karsner was paid $120,000 for consulting services for the year ended December 31, 2013 and there was no amount owed as of December 31, 2013.
10. Commitments and Contingencies
Operating Leases
The Company's headquarters are located in Redwood City, California where it occupies approximately 107,000 square feet of office and laboratory space in four buildings within the same business park from Metropolitan Life Insurance Company ("MetLife"). The Company entered into the initial lease with Met Life for a portion of this space in 2004 and the lease has been amended numerous times since then to add and subtract space and amend the terms of the lease, with the latest amendment being in 2012. The various terms for the spaces under the lease have expiration dates that range from January 2017 through January 2020. Annual lease payments for the Redwood City properties totaled $2,587,000 in 2013.
As of December 31, 2012, we incurred $3,600,000 of capital improvement costs related to the facilities leased from MetLife. During 2011 and 2012, we requested and received $3,100,000 of reimbursements from the landlord out of the tenant improvement and HVAC allowances for the completed construction. The reimbursements were recorded once cash was received and is amortized on a straight line basis over the term of the lease as a reduction in rent expense. As of December 31, 2013, the lease incentive obligation remaining as a long-term liability on the Balance Sheet was $2,160,000.
Rent expense for the Redwood City properties is recognized on a straight-line basis over the term of the lease. In accordance with the terms of the amended lease agreement, the Company exercised its right to deliver a letter of credit in lieu of a security
77
deposit. The letters of credit in the amount of $707,000 as of December 31, 2013 and 2012 are collateralized by deposit balances held by the bank. These deposits are recorded as restricted cash on the consolidated balance sheets.
The Company also rents facilities in Hungary. Rent expense is being recognized on a straight-line basis over the respective terms of the lease. This lease requires annual lease payments of approximately $309,000 and expires in September 2016.
The Company's leased facility in Singapore has been vacated, the lease terminated and the Company recorded a cease use liability of $354,000 representing the remaining six months lease term for the facility as an accrued expense at December 31, 2012, which was paid in 2013.
As of December 31, 2013 and 2012, the Company had asset retirement obligations of $109,000 from operating leases, whereby the Company must restore the facilities that the Company is renting to their original form. The Company is expensing the asset retirement obligation over the terms of the respective leases. The Company reviews the estimated obligation each reporting period and makes adjustments if its estimates change.
Future minimum payments under noncancellable operating leases are as follows at December 31, 2013 (in thousands):
Lease Payments |
|||
Years ending December 31, |
|||
2014 |
$ |
2,968 |
|
2015 |
3,053 |
||
2016 |
3,063 |
||
2017 |
2,677 |
||
2018 |
2,736 |
||
2019 and beyond |
3,054 |
||
Total |
$ |
17,551 |
|
Litigation
The Company has been subject to various legal proceedings related to matters that have arisen during the ordinary course of business. Although there can be no assurance as to the ultimate disposition of these matters, the Company has determined, based upon the information available, that the expected outcome of these matters, individually or in the aggregate, will not have a material adverse effect on the Company's consolidated financial position, results of operations or cash flows.
Indemnifications
The Company is required to recognize a liability for the fair value of any obligations the Company assumes upon the issuance of a guarantee. The Company has certain agreements with licensors, licensees and collaborators that contain indemnification provisions. In such provisions, the Company typically agrees to indemnify the licensor, licensee and collaborator against certain types of third party claims. The maximum amount of the indemnifications is not limited. The Company accrues for known indemnification issues when a loss is probable and can be reasonably estimated. There were no accruals for expenses related to indemnification issues for any periods presented.
Other contingencies
On July 30, 2013, Dyadic delivered notice to the Company alleging that it is in breach under the Dyadic license agreement and stating that Dyadic intended to terminate the Dyadic license agreement in 60 days if the alleged breach was not cured to Dyadic's satisfaction. This notice was subsequently withdrawn by Dyadic in February 2014 in light of the Company's decision to wind down its CodeXyme® cellulase enzyme program. Although the Company does not believe that the use of the licensed technology in its CodeXyme® cellulase enzyme program constituted a breach of the Dyadic license agreement , the Company can make no assurances that Dyadic will not make such allegations again in the future, or regarding the Company's ability to resolve any possible future disputes with Dyadic on commercially reasonable terms or the Company's ability to dispute with success, through legal action or otherwise, any possible future allegations by Dyadic that such use may have breached the Dyadic license agreement.
In November 2009, one of the Company's foreign subsidiaries sold intellectual property to the Company. Under the local laws, the sale of intellectual property to a nonresident legal entity is deemed an export and is not subject to value added tax. However, there is uncertainty regarding whether the items sold represented intellectual property or research and development services, which would subject the sale to value added tax. The Company believes that the uncertainty results in an exposure to
78
pay value added tax that is more than remote but less than likely to occur and, accordingly, have not recorded an accrual for this exposure. Should the sale be deemed a sale of research and development services, the Company could be obligated to pay an estimated amount of $0.6 million. No amount related to this contingency has been recorded as a payable as of December 31, 2013.
11. Warrants
The Company's outstanding warrants are exercisable for common stock at any time during their respective terms. During the year ended December 31, 2012, 6,066 warrants were exercised in a net share transaction to acquire 3,308 shares of the Company's common stock. No warrants were exercised during 2013.
At December 31, 2013, the following warrants were issued and outstanding:
Issue Date |
Shares Subject
to warrants
|
Exercise Price
per Share
|
Expiration |
|||||
July 17, 2007 |
2,384 |
$ |
12.45 |
February 9, 2016 |
||||
September 28, 2007 |
72,727 |
8.25 |
September 28, 2017 |
|||||
12. Stockholders' Equity
Stockholder Rights Plan
In August 2012, the Company's board of directors adopted a stockholder rights plan and declared a dividend of one preferred share purchase right for each share of its common stock held by stockholders of record as of September 18, 2012. Each right entitles stockholders, after the rights become exercisable, to purchase one one thousandth of a share of the Company's Series A Junior Participating Preferred Stock, par value $0.0001, at a purchase price of $11.35 per one-thousandth of a share of Series A Junior Participating Preferred Stock. In general, the rights become exercisable when a person or group acquires 15% or more of the Company's common stock or a tender offer for 15% or more of its common stock is announced or commenced. These rights expired in accordance with the terms of the stockholder rights plan on September 2, 2013. Therefore, the shares of the Company's common stock are no longer accompanied by the rights, and the plan is of no further force or effect.
Accumulated Other Comprehensive Income (Loss)
The components of accumulated other comprehensive income (loss), net of tax, and other comprehensive income (loss) are summarized as follows (in thousands):
Net Unrealized Gains on Marketable Securities |
Cumulative Translation Adjustment |
Accumulated Other Comprehensive Income (Loss) |
|||||||||
Balance at December 31, 2010 |
$ |
128 |
$ |
(162 |
) |
$ |
(34 |
) |
|||
Other comprehensive loss |
(370 |
) |
(3 |
) |
(373 |
) |
|||||
Balance at December 31, 2011 |
(242 |
) |
(165 |
) |
(407 |
) |
|||||
Other comprehensive loss |
(647 |
) |
165 |
(482 |
) |
||||||
Reclassification of Other-Than-Temporary Loss in Marketable Securities |
753 |
— |
753 |
||||||||
Balance at December 31, 2012 |
(136 |
) |
— |
(136 |
) |
||||||
Other comprehensive loss |
104 |
— |
104 |
||||||||
Balance at December 31, 2013 |
$ |
(32 |
) |
$ |
— |
$ |
(32 |
) |
|||
13. Stock-based Compensation
Stock Plans
In 2002, the Company adopted the 2002 Stock Plan (the “2002 Plan”), pursuant to which its board of directors issued incentive stock options, non-statutory stock options and stock purchase rights to its employees, officers, directors or consultants. In
March 2010, the Company's board of directors and stockholders approved the 2010 Equity Incentive Award Plan (the “2010 Plan”), which became effective upon the completion of its IPO in April 2010. The 2010 Plan is similar to the 2002 Plan but allows for issuance of additional awards, such as a restricted stock unit (“RSU”), performance stock unit (“PSU”), deferred stock award and stock appreciation rights. A total of 1,100,000 shares of common stock were initially reserved for future issuance under the 2010 Plan and any shares of common stock reserved for future grant or issuance under the Company's 2002 Plan that remained unissued at the time of completion of the IPO became available for future grant or issuance under the 2010 Plan. In addition, the shares reserved for issuance pursuant to the exercise of any outstanding awards under the 2002 Plan that expire unexercised will also become available for future issuance under the 2010 Plan. The 2010 Plan also provides for automatic annual increases in the number of shares reserved for future issuance.
A summary of share-based activity is as follows (in thousands):
|
Shares
Available
for Grant
|
||
December 31, 2012 |
3,767 |
|
Annual increase in shares available for grant |
1,507 |
|
Option grants |
(922 |
) |
RSU award grants |
(2,101 |
) |
RSU award shares withheld for taxes |
132 |
|
RSA award grants |
(216 |
) |
PSU award grants |
(523 |
) |
Options forfeited, cancelled or expired |
2,603 |
|
RSU awards forfeited, cancelled or expired |
165 |
|
PSU awards forfeited, cancelled or expired |
496 |
|
December 31, 2013 |
4,908 |
|
Stock Options
Awards granted under the 2002 Plan and 2010 Plan expire no later than 10 years from the date of grant. For incentive stock options and nonstatutory stock options, the option price shall be at least 100% and 85%, respectively, of the fair value of the common stock on the date of grant, as determined by the board of directors. If, at the time of a grant, the optionee directly or by attribution owns stock possessing more than 10% of the total combined voting power of all of the Company's outstanding capital stock, the exercise price for these options must be at least 110% of the fair value of the underlying common stock. Options typically vest over a 4-year period at a rate of no less than 25% per year but may be granted with different vesting terms.
A summary of stock option activity for the years ended December 31, 2011, 2012 and 2013 is as follows (in thousands, except per share amounts and years):
79
Options Outstanding |
|||||||||||||
|
Number of
Options
|
Weighted
Average
Exercise Price
per Share
|
Weighted Average Remaining Contractual Terms (years) |
Aggregate Intrinsic Value |
||||||||||
December 31, 2010 |
7,796 |
$ |
6.27 |
6.57 |
$ |
34,228 |
|||||||
Grants |
1,751 |
9.33 |
|||||||||||
Exercises |
(1,167 |
) |
2.21 |
9,077 |
|||||||||
Early exercised options repurchased |
(476 |
) |
9.51 |
||||||||||
Forfeited/Cancelled |
— |
— |
|||||||||||
December 31, 2011 |
7,904 |
7.35 |
6.77 |
6,570 |
|||||||||
Grants |
1,521 |
3.42 |
|||||||||||
Exercises |
(708 |
) |
1.78 |
925 |
|||||||||
Forfeited/Cancelled |
(2,584 |
) |
8.23 |
||||||||||
December 31, 2012 |
6,133 |
6.65 |
4.91 |
657 |
|||||||||
Grants |
922 |
2.28 |
|||||||||||
Exercises |
(326 |
) |
0.98 |
409 |
|||||||||
Forfeited/Cancelled |
(2,603 |
) |
7.35 |
||||||||||
December 31, 2013 |
4,126 |
5.68 |
5.75 |
87 |
|||||||||
Options vested and expected to vest at December 31, 2013 |
4,006 |
5.77 |
5.66 |
87 |
|||||||||
Options exercisable at December 31, 2013 |
2,805 |
$ |
6.76 |
4.37 |
$ |
87 |
|||||||
The weighted-average grant date fair value of options granted during the years ended December 31, 2013, 2012 and 2011 was $1.34, $1.91, and $5.19, respectively.
The intrinsic value of options outstanding, vested and expected to vest, and exercisable as of December 31, 2013 is calculated based on the difference between the exercise price and the fair value of the Company’s common stock as of December 31, 2013. The aggregate intrinsic value of exercised stock options is calculated based on the difference between the exercise price and the fair value of the Company’s common stock as of the exercise date.
At December 31, 2013, there was $2,177,000 of unrecognized stock-based compensation cost for outstanding options which is expected to be recognized over an average period of 2.66 years.
The following table summarizes information about stock options outstanding and exercisable at December 31, 2013 (amounts in thousands, except per share and years):
Options Outstanding |
Options Exercisable |
||||||||||||||
Exercise Prices |
Number
of
Options
|
Weighted
Average
Remaining
Contractual
Term
(Years)
|
Weighted
Average
Exercise
Price per
Share
|
Number
of
Options
|
Weighted
Average
Exercise
Price per
Share
|
||||||||||
$0.68 - $2.32 |
869 |
7.30 |
$ |
1.96 |
199 |
$ |
0.96 |
||||||||
$2.34 - $3.46 |
971 |
6.50 |
2.93 |
561 |
2.76 |
||||||||||
$3.56 - $7.40 |
719 |
5.30 |
5.31 |
595 |
5.60 |
||||||||||
$7.41 - $9.81 |
721 |
4.36 |
8.38 |
673 |
8.34 |
||||||||||
$9.82 - $11.87 |
846 |
4.88 |
10.66 |
777 |
10.67 |
||||||||||
4,126 |
5.75 |
$ |
5.68 |
2,805 |
$ |
6.76 |
|||||||||
Restricted stock units
RSUs issued generally vest over four years with 25% of the RSUs vesting annually. The fair value of the RSUs was calculated based on the NASDAQ quoted stock price on the date of the grant with the expense recognized on a straight-line basis over the requisite service period.
80
A summary of RSU activity for the years ended December 31, 2011, 2012 and 2013 is as follows (in thousands, except per share amounts and years):
RSUs Outstanding |
|||||||||||||
|
Number of RSUs
|
Weighted Average Grant Date Fair Value Per Share |
Weighted Average Remaining Contractual Terms (years) |
Aggregate Intrinsic Value |
||||||||||
December 31, 2010 |
— |
||||||||||||
Grants |
578 |
$ |
9.54 |
||||||||||
Shares released |
— |
||||||||||||
Forfeited/Cancelled |
(32 |
) |
|||||||||||
December 31, 2011 |
546 |
1.66 |
$ |
2,895 |
|||||||||
Grants |
1,148 |
$ |
3.54 |
||||||||||
Shares released |
(167 |
) |
|||||||||||
Forfeited/Cancelled |
(569 |
) |
|||||||||||
December 31, 2012 |
958 |
1.21 |
$ |
2,117 |
|||||||||
Grants |
2,101 |
$ |
1.80 |
||||||||||
Shares released |
(325 |
) |
|||||||||||
Forfeited/Cancelled |
(496 |
) |
|||||||||||
December 31, 2013 |
2,238 |
1.10 |
$ |
3,133 |
|||||||||
RSUs vested and expected to vest at December 31, 2013 |
2,015 |
$ |
2,821 |
||||||||||
The intrinsic value of RSUs outstanding and vested and expected to vest as of December 31, 2013 is calculated based on the fair value of the Company’s common stock as of December 31, 2013. The aggregate intrinsic value of RSUs released is calculated based on the fair value of the Company’s common stock as of the vesting date.
The fair value of RSUs released during the years ended December 31, 2013 and 2012 was $726,000 and $591,000, respectively. The majority of RSUs that vested in 2013 and 2012 were net-share settled such that the Company withheld shares with value equivalent to the employees’ minimum statutory obligation for the applicable income and other employment taxes, and remitted the cash to the appropriate taxing authorities. The Company pays the taxes on behalf of the restricted stock unit holder, returns the withheld restricted stock units to the shares available for grant pool and did not represent an expense to the Company.
At December 31, 2013, there was $3,385,000 of unrecognized stock-based compensation cost for outstanding RSUs which is expected to be recognized over an average period of 1.81 years.
Performance Stock Units
PSUs awarded may be conditional upon the attainment of one or more performance objectives over a specified period. Total compensation expense for PSUs is determined by the product of the number of shares eligible to be awarded and expected to vest, and the market price of the Company's common stock, commencing at the inception of the requisite service period. During the performance period, the compensation expense for PSUs is re-computed using the market price and the performance modifier at the end of a reporting period. At the end of the performance period, if the goals are attained, the awards are granted. The Company recognizes compensation expense of these awards on a straight-line basis over the vesting period.
The Company awarded 523,048 PSUs under the 2010 Plan during the year ended December 31, 2013 based upon achieving certain cashflow criteria for 2013. A 100% achievement of the performance goal would result in one common share issued for each vested PSU. In the third quarter of 2013, the Company revised its estimate of forecasted performance criteria and concluded that the performance target would not likely be achieved in 2013. As a result of the revised estimate of the performance goal, the PSU-related compensation expense of $298,000 recorded on a year to date basis was fully reversed at September 30, 2013. At December 31, 2013, there were 358,308 PSUs outstanding, which were cancelled in February 2014 based on not attaining the performance target.
Restricted Stock Awards
81
In June 2012, the Company granted 750,000 restricted stock awards and 400,000 options, pursuant to the employment agreement with its new chief executive officer, Mr. John Nicols. The restricted stock award of 750,000 shares vests over four years with 25% of the award vesting on each annual anniversary of Mr. Nichols' start date such that the restricted stock award would be fully vested on June 13, 2016.
In September 2012, the Company granted 50,000 restricted stock awards and 200,000 options, pursuant to the offer letter agreement with its new chief financial officer, Mr. David O’Toole. The restricted stock award of 50,000 shares vest over four years with 25% of the awards vesting on each annual anniversary of Mr. O’Toole’s start date such that the restricted stock award would be fully vested on September 4, 2016.
In January 2013, the Company granted a total of 215,515 restricted stock awards to specific non-employee members of its board of directors with a total value of $500,000. These awards vest over three years with 33% of the awards vesting on each annual anniversary of the grant date.
At December 31, 2013, there was $1,714,000 of unrecognized stock-based compensation cost for outstanding restricted stock awards which is expected to be recognized over an average period of 2.36 years.
Stock-Based Compensation Expense
The following table presents stock-based compensation expense included in the consolidated statements of operations (in thousands):
Years Ended December 31, |
|||||||||||
2013 |
2012 |
2011 |
|||||||||
Research and development |
$ |
1,201 |
$ |
2,334 |
$ |
3,311 |
|||||
Selling, general and administrative |
3,188 |
2,742 |
6,120 |
||||||||
$ |
4,389 |
$ |
5,076 |
$ |
9,431 |
||||||
Stock-based compensation expense attributable to cost of goods sold was immaterial. Stock-based compensation costs capitalized during the years ended December 31, 2013, 2012, and 2011 were insignificant.
There were no stock-based compensation tax benefits during the years ended December 31, 2013, 2012, and 2011.
The Company estimates the fair value of stock-based awards granted to employees and directors using the Black- Scholes option-pricing model. The Black-Scholes option-pricing model requires the use of highly subjective and complex assumptions to determine the fair value of stock-based awards, including the expected life of the option and expected volatility of the underlying stock over the expected life of the related grants.
The Company used the following assumptions to estimate the fair value of its employee option grants:
Years Ended December 31, |
||||||||
2013 |
2012 |
2011 |
||||||
Weighted-average expected life (years) |
6.0 |
6.0 |
6.1 |
|||||
Weighted-average expected volatility |
65 |
% |
61 |
% |
58 |
% |
||
Weighted-average risk free interest rate |
1.2 |
% |
1.0 |
% |
2.2 |
% |
||
Expected dividend yield |
0.0 |
% |
0.0 |
% |
0.0 |
% |
||
Since the Company was not a publicly traded entity prior to April 2010, sufficient company-specific historical volatility data was not available for reporting periods prior to the second quarter of 2012. As a result, for those periods, the Company estimated the expected volatility based on the historical volatility of a group of unrelated public companies within its industry. Effective for the second quarter of 2012, the Company determined it had sufficient company-specific historical volatility data. As a result, the Company estimates the expected volatility based on historical volatility of its common stock.
Due to the Company's limited history of grant activity, the expected life of options granted to employees is calculated using the “simplified method” permitted by the SEC as the average of the total contractual term of the option and its vesting period. The risk-free rate assumption was based on United States Treasury instruments whose terms were consistent with the terms of its stock options. The expected dividend assumption was based on the Company's history and expectation of dividend payouts.
82
14. Income Taxes
The Company's loss before provision for income taxes was as follows (in thousands):
Years Ended December 31, |
|||||||||||
2013 |
2012 |
2011 |
|||||||||
United States |
$ |
(41,696 |
) |
$ |
(30,743 |
) |
$ |
(17,474 |
) |
||
Foreign |
306 |
156 |
1,165 |
||||||||
Loss before provision for income taxes |
$ |
(41,390 |
) |
$ |
(30,587 |
) |
$ |
(16,309 |
) |
||
The tax provision for the years ended December 31, 2013, 2012 and 2011 consists primarily of taxes attributable to foreign operations. The components of the provision for income taxes are as follows (in thousands):
Years Ended December 31, |
|||||||||||
2013 |
2012 |
2011 |
|||||||||
Current provision (benefit): |
|||||||||||
Federal |
$ |
— |
$ |
— |
$ |
3 |
|||||
State |
5 |
7 |
7 |
||||||||
Foreign |
(45 |
) |
178 |
82 |
|||||||
Total current provision |
(40 |
) |
185 |
92 |
|||||||
Deferred provision (benefit): |
|||||||||||
Federal |
(59 |
) |
(62 |
) |
— |
||||||
State |
(7 |
) |
(7 |
) |
— |
||||||
Foreign |
19 |
154 |
149 |
||||||||
Total deferred provision |
(47 |
) |
85 |
149 |
|||||||
Total provision for (benefit from) income taxes |
$ |
(87 |
) |
$ |
270 |
$ |
241 |
||||
Reconciliation of the provision for income taxes calculated at the statutory rate to the Company's provision for (benefit from) income taxes is as follows (in thousands):
Years Ended December 31, |
|||||||||||
2013 |
2012 |
2011 |
|||||||||
Tax benefit at federal statutory rate |
$ |
(14,073 |
) |
$ |
(10,399 |
) |
$ |
(5,708 |
) |
||
State taxes |
(1,948 |
) |
(1,063 |
) |
(1,421 |
) |
|||||
Research and development credits |
(195 |
) |
— |
(83 |
) |
||||||
Foreign operations taxed at different rates |
(108 |
) |
7 |
(252 |
) |
||||||
Stock-based compensation |
117 |
312 |
1,241 |
||||||||
Other nondeductible items |
(1,272 |
) |
204 |
650 |
|||||||
Change in federal statutory rate |
— |
1,493 |
— |
||||||||
Change in valuation allowance |
17,392 |
9,716 |
5,814 |
||||||||
Provision for (benefit from) income taxes |
$ |
(87 |
) |
$ |
270 |
$ |
241 |
||||
Deferred income taxes reflect the net tax effects of (a) temporary differences between the carrying amounts of assets and liabilities for financial reporting purposes and the amounts used for income tax purposes, and (b) operating losses and tax credit carryforwards.
83
Significant components of the Company's deferred tax assets and liabilities are as follows (in thousands):
December 31, |
|||||||
2013 |
2012 |
||||||
Deferred tax assets: |
|||||||
Net operating losses |
$ |
67,507 |
$ |
54,923 |
|||
Credits |
4,194 |
3,329 |
|||||
Deferred revenues |
1,198 |
1,297 |
|||||
Stock-based compensation |
3,043 |
4,464 |
|||||
Reserves and accruals |
3,626 |
2,090 |
|||||
Depreciation |
2,247 |
1,746 |
|||||
Intangible assets |
4,208 |
3,556 |
|||||
Unrealized gain/loss |
112 |
166 |
|||||
Other assets |
159 |
141 |
|||||
Total deferred tax assets: |
86,294 |
71,712 |
|||||
Deferred tax liabilities: |
|||||||
Other |
— |
— |
|||||
Total deferred tax liabilities: |
— |
— |
|||||
Valuation allowance |
(86,294 |
) |
(71,692 |
) |
|||
Net deferred tax assets |
$ |
— |
$ |
20 |
|||
ASC Topic 740 requires that the tax benefit of NOL, temporary differences and credit carryforwards are recorded as an asset to the extent that management assesses that realization is “more likely than not.” Realization of the future tax benefits is dependent on the Company's ability to generate sufficient taxable income within the carryforward period. Because of the Company's history of operating losses, management believes that recognition of the deferred tax assets arising from the above-mentioned future tax benefits is currently not more likely than not to be realized and, accordingly, has provided a valuation allowance against the Company's deferred tax assets. Accordingly, the net deferred tax assets in all the Company's jurisdictions have been fully reserved by a valuation allowance. The net valuation allowance increased by $14,600,000, $8,600,000 and $5,800,000 during the years ended December 31, 2013, 2012 and 2011, respectively. At such time as it is determined that it is more likely than not that the deferred tax assets are realizable, the valuation allowance will be reduced.
The following table sets forth the Company's federal, state and foreign NOL carryforwards and federal research and development tax credits as of December 31, 2013 (in thousands):
December 31, 2013 |
|||||
Amount |
Expiration
Years
|
||||
Net operating losses, federal |
$ |
184,818 |
2022-2033 |
||
Net operating losses, state |
148,325 |
2015-2033 |
|||
Tax credits, federal |
5,138 |
2022-2033 |
|||
Tax credits, state |
5,459 |
Do not expire |
|||
Net operating losses, foreign |
15,403 |
Various |
|||
Tax credits, foreign |
$ |
16 |
Various |
||
Current federal and California tax laws include substantial restrictions on the utilization of NOLs and tax credit carryforwards in the event of an ownership change of a corporation. Accordingly, the Company's ability to utilize NOLs and tax credit carryforwards may be limited as a result of such ownership changes. Such a limitation could result in the expiration of carryforwards before they are utilized.
Income tax expense or benefit from continuing operations is generally determined without regard to other categories of earnings, such as discontinued operations and other comprehensive income. An exception is provided in ASC 740 when there is aggregate income from categories other than continuing operations and a loss from continuing operations in the current year. In this case, the tax benefit allocated to continuing operations is the amount by which the loss from continuing operations reduces
84
the tax expenses recorded with respect to the other categories of earnings, even when a valuation allowance has been established against the deferred tax assets. In instances where a valuation allowance is established against current year losses, income from other sources, including gain from available-for-sale securities recorded as a component of other comprehensive income, is considered when determining whether sufficient future taxable income exists to realize the deferred tax assets. As a result, for the year ended December 31, 2013, the Company recorded a tax expense of $66,000 in other comprehensive income related to the gain on available-for-sale securities, and recorded a corresponding tax benefit of $66,000 in continuing operations.
The Company has not provided for United States federal and state income taxes on all of the non-United States subsidiaries’ undistributed earnings as of December 31, 2013, because such earnings are intended to be indefinitely reinvested. As of December 31, 2013, cumulative unremitted foreign earnings that are considered to be permanently invested outside the United States and on which no United States taxes have been provided were approximately $1,300,000. The residual United States tax liability, if such amounts were remitted, would be nominal.
The Company adopted ASC's Topic 740's provision for accounting for uncertainty in income taxes on January 1, 2007. A reconciliation of the beginning and ending amount of unrecognized tax benefits is as follows (in thousands):
December 31, |
|||||||||||
2013 |
2012 |
2011 |
|||||||||
Balance at beginning of year |
$ |
7,420 |
$ |
6,611 |
$ |
6,492 |
|||||
Additions based on tax positions related to current year |
1,116 |
709 |
470 |
||||||||
Additions to tax provision of prior years |
6 |
263 |
4 |
||||||||
Reductions to tax provision of prior years |
(78 |
) |
24 |
(262 |
) |
||||||
Lapse of the applicable statute of limitations |
(158 |
) |
(187 |
) |
(93 |
) |
|||||
Balance at end of year |
$ |
8,306 |
$ |
7,420 |
$ |
6,611 |
|||||
The Company recognizes interest and penalties as a component of the Company's income tax expense. Total interest and penalties recognized in the consolidated statement of operations was $29,000, $11,000 and $39,000, respectively, in 2013, 2012 and 2011. Total penalties and interest recognized in the balance sheet was $280,000 and $250,000, respectively, in 2013 and 2012. The total unrecognized tax benefits that, if recognized currently, would impact the Company's effective tax rate were $1,000,000 and $1,500,000 as of December 31, 2013 and 2012, respectively. The Company expects $663,000 of unrecognized tax benefits to be recognized within the next 12 months of which $439,000 will impact the Company's effective tax rate. The Company is not subject to examination by United States federal or state tax authorities for years prior to 2002 and foreign tax authorities for years prior to 2007.
15. 401(k) Plan
In January 2005, the Company implemented a 401(k) Plan covering certain employees. Currently, all of the Company's United States based employees over the age of 18 are eligible to participate in the 401(k) Plan. Under the 401(k) Plan, eligible employees may elect to reduce their current compensation up to a certain annual limit and contribute these amounts to the 401(k) Plan. The Company may make matching or other contributions to the 401(k) Plan on behalf of eligible employees. During the year end December 31, 2013, the Company recorded $488,000 in expense for matching contributions to the 401(k) Plan. In the years ended December 31, 2012 and 2011, the Company did not make any contributions to the 401(k) Plan on behalf of eligible employees.
16. Segment Reporting
Operating segments are defined as components of an enterprise about which separate financial information is available that is evaluated regularly by the chief operating decision maker, or decision making group, in deciding how to allocate resources and in assessing performance. The Company's chief operating decision maker is its Chief Executive Officer. The Chief Executive Officer and the Company's board of directors review financial information presented on a consolidated basis, accompanied by information about revenues by geographic region, for purposes of allocating resources and evaluating financial performance. The Company has one business activity and there are no segment managers who are held accountable for operations, operating results beyond revenue goals or plans for levels or components below the consolidated unit level. Accordingly, the Company has a single reporting segment. Operations outside of the United States consist principally of research and development and sales activities.
Geographic revenues are identified by the location of the customer and consist of the following (in thousands):
85
Years Ended December 31, |
|||||||||||
2013 |
2012 |
2011 |
|||||||||
Revenues |
|||||||||||
United States |
$ |
11,005 |
$ |
51,714 |
$ |
72,355 |
|||||
Europe |
9,568 |
11,150 |
16,751 |
||||||||
Asia |
|||||||||||
India |
3,099 |
16,813 |
21,063 |
||||||||
Singapore |
7,220 |
7,507 |
12,008 |
||||||||
Others |
1,030 |
1,114 |
1,688 |
||||||||
$ |
31,922 |
$ |
88,298 |
$ |
123,865 |
||||||
Geographic presentation of identifiable long-lived assets below shows those assets that can be directly associated with a particular geographic area and consist of the following (in thousands):
December 31, |
|||||||||||
2013 |
2012 |
2011 |
|||||||||
Long-lived assets |
|||||||||||
United States |
$ |
16,189 |
$ |
25,953 |
$ |
34,817 |
|||||
Europe (1) |
2,123 |
5,157 |
4,395 |
||||||||
Asia |
— |
711 |
2,380 |
||||||||
$ |
18,312 |
$ |
31,821 |
$ |
41,592 |
||||||
(1) |
Primarily Hungary |
86
17. Restructuring
Q1 2012 Restructuring Plan
During the first quarter of 2012, the Company's board of directors approved and committed to a restructuring plan (the “Q1 2012 Restructuring Plan”) to reduce its cost structure, which included a total of 13 employee terminations in Hungary, Singapore, and the United States. Costs of $572,000 were originally recognized in selling, general and administrative expenses during the year ended December 31, 2012, comprised of employee severance and other termination benefits. The Company made cash payments of $512,000 and recorded $60,000 of reductions to previously recorded charges during 2012 and have no further obligations under this restructuring plan.
Q3 2012 Restructuring Plan
As a result of the termination of the Shell Research Agreement, the Company initiated a series of cost reduction measures. During the third quarter of 2012, the Company's board of directors approved and committed to a restructuring plan (the “Q3 2012 Restructuring Plan”) to reduce its cost structure which included approximately 173 employee terminations in the United States and Singapore and the closing of the Company's Singapore facility. Approximately 150 of the total 173 employee terminations impacted the research and development functions with the remaining 23 employees impacted the general and administrative functions.
The Company's cost of the Q3 2012 Restructuring Plan was $2,418,000, comprised of $1,071,000 of leasehold improvement write down, $684,000 for employee severance and other termination benefits, $320,000 for facility lease termination costs and $342,000 for equipment disposal charges. For the twelve months ended December 31, 2012, costs of $1,470,000 have been recognized in selling, general and administrative expenses and $948,000 have been recognized in research and development on the Company's consolidated statements of operations. As of December 31, 2012, there was $68,000 recorded in accrued compensation and $352,000 recorded as accrued expenses on the Company's consolidated balance sheet and the remaining payments were made in 2013. The Company does not anticipate recording any further costs under this restructuring plan.
Q4 2013 Restructuring Plan
During the fourth quarter of 2013, the Company's board of directors approved and committed to a restructuring plan (the “Q4 2013 Restructuring Plan”) to reduce its cost structure resulting from the Company's decision to begin winding down its CodeXyme® cellulase enzymes program, which included a total of 15 employee terminations in the United States. For the year ended December 31, 2013, costs of $809,000 of employee severance and other termination benefits have been recognized, consisting of $573,000 in research and development expenses and $236,000 in selling, general and administrative expenses. As of December 31, 2013, there was $277,000 recorded in accrued compensation on the Company's consolidated balance sheet. Associated with the Q4 2013 Restructuring Plan, the Company announced it was selling certain R&D assets that have become excess to future requirements (see Note 5). The Company does not anticipate recording any further costs under this restructuring plan.
The following table summarizes the activity in the restructuring accrual during the years ended December 31, 2013 and 2012 (in thousands):
Q1 2012 Restructuring Plan |
Q3 2012 Restructuring Plan |
Q4 2013 Restructuring Plan |
Total |
||||||||||||
Restructuring charges |
$ |
572 |
$ |
2,537 |
$ |
— |
$ |
3,109 |
|||||||
Cash payments |
(512 |
) |
(611 |
) |
— |
(1,123 |
) |
||||||||
Leasehold improvements write-down and equipment disposal charges |
— |
(1,413 |
) |
— |
(1,413 |
) |
|||||||||
Adjustments to previously accrued charges |
(60 |
) |
(93 |
) |
— |
(153 |
) |
||||||||
Balance at December 31, 2012 |
— |
420 |
— |
420 |
|||||||||||
Restructuring charges |
— |
809 |
809 |
||||||||||||
Cash payments |
— |
(345 |
) |
(532 |
) |
(877 |
) |
||||||||
Non-cash items |
— |
(49 |
) |
— |
(49 |
) |
|||||||||
Adjustments to previously accrued charges |
— |
(26 |
) |
— |
(26 |
) |
|||||||||
Balance at December 31, 2013 |
$ |
— |
$ |
— |
$ |
277 |
$ |
277 |
|||||||
87
18. Selected Quarterly Financial Data (Unaudited)
The following table provides the selected quarterly financial data for 2013 and 2012 (in thousands):
Condensed Consolidated Statements of Operations
(In Thousands, Except Per Share Amounts)
Quarter Ended |
|||||||||||||||||||||||||||||||
December 31, 2013 |
September 30, 2013 |
June 30, 2013 |
March 31, 2013 |
December 31, 2012 |
September 30, 2012 |
June 30, 2012 |
March 31, 2012 |
||||||||||||||||||||||||
Revenues: |
|||||||||||||||||||||||||||||||
Product |
$ |
5,263 |
$ |
1,076 |
$ |
4,948 |
$ |
9,136 |
$ |
6,834 |
$ |
7,140 |
$ |
6,783 |
$ |
15,167 |
|||||||||||||||
Collaborative research and development |
1,931 |
2,028 |
1,609 |
1,300 |
1,078 |
18,569 |
15,868 |
14,362 |
|||||||||||||||||||||||
Revenue sharing arrangement |
2,331 |
839 |
417 |
1,044 |
— |
— |
— |
250 |
|||||||||||||||||||||||
Government awards |
— |
— |
— |
— |
— |
632 |
258 |
1,357 |
|||||||||||||||||||||||
Total revenues |
9,525 |
3,943 |
6,974 |
11,480 |
7,912 |
26,341 |
22,909 |
31,136 |
|||||||||||||||||||||||
Costs and operating expenses: |
|||||||||||||||||||||||||||||||
Cost of product revenues |
4,764 |
494 |
3,631 |
5,665 |
5,779 |
6,397 |
5,829 |
12,642 |
|||||||||||||||||||||||
Research and development |
8,829 |
6,831 |
8,624 |
7,322 |
10,594 |
14,191 |
15,650 |
16,349 |
|||||||||||||||||||||||
Selling, general and administrative |
5,783 |
5,832 |
7,169 |
8,124 |
7,286 |
7,909 |
6,789 |
9,395 |
|||||||||||||||||||||||
Total costs and operating expenses |
19,376 |
13,157 |
19,424 |
21,111 |
23,659 |
28,497 |
28,268 |
38,386 |
|||||||||||||||||||||||
Loss before income taxes |
(9,858 |
) |
(9,227 |
) |
(12,617 |
) |
(9,688 |
) |
(15,711 |
) |
(2,140 |
) |
(5,442 |
) |
(7,293 |
) |
|||||||||||||||
Net loss |
$ |
(9,813 |
) |
$ |
(9,262 |
) |
$ |
(12,605 |
) |
$ |
(9,623 |
) |
$ |
(15,538 |
) |
$ |
(2,309 |
) |
$ |
(5,519 |
) |
$ |
(7,490 |
) |
|||||||
Net loss per share, basic and diluted |
$ |
(0.26 |
) |
$ |
(0.24 |
) |
$ |
(0.33 |
) |
$ |
(0.25 |
) |
$ |
(0.41 |
) |
$ |
(0.06 |
) |
$ |
(0.15 |
) |
$ |
(0.21 |
) |
|||||||
Weighted average common shares used in computing net loss per share, basic and diluted (1) |
38,329 |
38,102 |
38,060 |
37,842 |
37,581 |
37,118 |
36,296 |
36,057 |
|||||||||||||||||||||||
(1) |
The full year net loss per share of common stock, basic and diluted, may not equal the sum of the quarters due to weighting of outstanding shares. |
ITEM 9. CHANGES IN AND DISAGREEMENTS WITH ACCOUNTANTS ON ACCOUNTING AND FINANCIAL DISCLOSURES
None.
ITEM 9A. CONTROLS AND PROCEDURES
Evaluation of Disclosure Controls and Procedures
Our management, under the supervision of our Chief Executive Officer and Chief Financial Officer and with the participation of our disclosure committee, evaluated the effectiveness of the design and operation of our disclosure controls and procedures as of December 31, 2013. The term “disclosure controls and procedures,” as defined in Rules 13a-15(e) and 15d-15(e) under the Exchange Act, means controls and other procedures of a company that are designed to ensure that information required to be disclosed by us in the reports that we file or submit under the Exchange Act is recorded, processed, summarized and reported within the time periods specified in the SEC's rules and forms. Disclosure controls and procedures include, without limitation, controls and procedures designed to ensure that information required to be disclosed by us in the reports that we file or submit under the Exchange Act is accumulated and communicated to our management, including our Chief Executive Officer and Chief Financial Officer, as appropriate, to allow timely decisions regarding required disclosure. Based on this evaluation, our Chief Executive Officer and Chief Financial Officer concluded that our disclosure controls and procedures were effective as of December 31, 2013 at the reasonable assurance level.
Management’s Report on Internal Control over Financial Reporting
Our management is responsible for establishing and maintaining adequate internal control over financial reporting, as such term is defined in Exchange Act Rules 13a-15(f) and 15d-15(f). Internal control over financial reporting is a process designed to provide reasonable assurance regarding the reliability of financial reporting and the preparation of financial statements for external reporting purposes in accordance with United States generally accepted accounting principles.
Under the supervision and with the participation of our management, including our Chief Executive Officer and Chief Financial Officer, we conducted an evaluation of the effectiveness of our internal control over financial reporting as of December 31, 2012 based on the guidelines established in Internal Control-Integrated Framework (1992) issued by the Committee of Sponsoring Organizations of the Treadway Commission (COSO). Based on the results of our evaluation, our management concluded that our internal control over financial reporting was effective as of December 31, 2013. We reviewed the results of management’s assessment with our Audit Committee.
Our internal control over financial reporting as of December 31, 2013 has been audited by BDO USA, LLP, an independent registered public accounting firm, as stated in their report which is included in Part II, Item 8 of this Annual Report.
Prior Material Weakness in Internal Control over Financial Reporting
A material weakness is a deficiency, or a combination of deficiencies, in internal controls over financial reporting, such that there is a reasonable possibility that a material misstatement of our financial statements will not be prevented or detected and corrected on a timely basis.
In connection with the integrated audit of our consolidated financial statements and internal control over financial reporting and management's assessment of our internal controls over financial reporting at December 31, 2012, a material weakness in our internal control over financial reporting was identified. The material weakness we identified relate to the lack of a sufficient number of qualified personnel to timely and appropriately account for complex, non-routine transactions in accordance with United States generally accepted accounting principles. Examples of these significant non-routine transactions include, but are not limited to, complicated revenue recognition transactions and complex contractual arrangements. The material weakness resulted in the recording of audit adjustments for the period ended December 31, 2012.
88
Management's Remediation Activities
With the oversight of senior management and our audit committee, we executed the implementation of the remediation steps in 2013. These efforts focused on (i) the hiring of accounting and finance personnel with technical accounting and financial reporting experience, (ii) the implementation of improved accounting and financial reporting procedures and (iii) a formal process to identify and evaluate significant non-routine transactions, including, but not limited to, complicated revenue recognition transactions and complex contractual arrangements, to ensure the application of the proper accounting treatment in accordance with United States generally accepted accounting principles.
We believe these steps, which are now fully implemented, have remediated the material weakness previously identified and have enhanced our internal control over financial reporting, as well as our disclosure controls and procedures. However, projections of any evaluation of effectiveness to future periods are subject to the risk that controls may become inadequate because of changes in conditions, or that the degree of compliance with the policies or procedures may deteriorate.
Changes in Internal Control over Financial Reporting
Other than the changes described above under “Management's Remediation Activities,” there were no changes in our internal control over financial reporting identified in connection with the evaluation required by paragraph (d) of Exchange Act Rules 13a-15 or 15d-15 that occurred during our last fiscal quarter that have materially affected, or are reasonably likely to materially affect, our internal control over financial reporting.
Inherent Limitations on Effectiveness of Controls
In designing and evaluating the disclosure controls and procedures, management recognizes that any controls and procedures, even if determined effective and no matter how well designed and operated, can provide only reasonable assurance of achieving the desired control objectives to prevent or detect misstatements. In addition, the design of disclosure controls and procedures must reflect the fact that there are resource constraints and that management is required to apply judgment in evaluating the benefits of possible controls and procedures relative to their costs. Also, projections of any evaluation of effectiveness to future periods are subject to the risk that controls may become inadequate because of changes in conditions, or that the degree of compliance with the policies or procedures may deteriorate.
ITEM 9B. OTHER INFORMATION
None.
89
PART III
ITEM 10. DIRECTORS, EXECUTIVE OFFICERS AND CORPORATE GOVERNANCE
The information required by this item concerning our directors, executive officers, compliance with Section 16 of the Exchange Act, our code of ethics and our Nominating and Corporate Governance Committee, and our Audit Committee is incorporated by reference from the information that will be set forth in the sections under the headings “Election of Directors,” “Other Matters—Section 16(a) Beneficial Ownership Reporting Compliance” and “Corporate Governance Matters” in our Definitive Proxy Statement to be filed with the Securities and Exchange Commission in connection with the Annual Meeting of Stockholders to be held in 2014 (the “2014 Proxy Statement”).
ITEM 11. EXECUTIVE COMPENSATION
The information required by this item concerning executive compensation is incorporated by reference from the information that will be set forth in the 2014 Proxy Statement under the headings “Executive Compensation,” and “Corporate Governance Matters”.
ITEM 12. SECURITY OWNERSHIP OF CERTAIN BENEFICIAL OWNERS AND MANAGEMENT AND RELATED STOCKHOLDER MATTERS
The information required by this item concerning securities authorized for issuance under equity compensation plans and security ownership of certain beneficial owners and management is incorporated by reference from the information that will be set forth in the 2014 Proxy Statement under the headings “Executive Compensation—Equity Compensation Plan Information” and “Information Concerning Voting and Solicitation—Security Ownership of Certain Beneficial Owners and Management.”
ITEM 13. CERTAIN RELATIONSHIPS AND RELATED TRANSACTIONS,
AND DIRECTOR INDEPENDENCE
The information required by this item concerning transactions with related persons and director independence is incorporated by reference from the information that will be set forth in the 2014 Proxy Statement under the headings “Certain Relationships and Related Transactions” and “Corporate Governance Matters.”
ITEM 14. PRINCIPAL ACCOUNTING FEES AND SERVICES
The information required by this item is incorporated by reference from the information that will be set forth in the 2014 Proxy Statement under the heading “Ratification of Independent Registered Public Accounting Firm—Principal Accounting Fees and Services.”
90
PART IV
ITEM 15. EXHIBITS, FINANCIAL STATEMENT SCHEDULES
1. |
Financial Statements: See “Index to Consolidated Financial Statements” in Part II, Item 8 of this Annual Report on Form 10-K |
2. |
Exhibits: The exhibits listed in the accompanying index to exhibits are filed or incorporated by reference as part of this Annual Report on Form 10-K. |
91
SIGNATURES
Pursuant to the requirements of Section 13 or 15(d) of the Securities Exchange Act of 1934, the registrant has duly caused this report to be signed on its behalf by the undersigned, thereunto duly authorized.
CODEXIS, INC. |
||
Date: March 12, 2014 |
By: |
/s/ John J. Nicols
|
President and Chief Executive Officer |
||
POWER OF ATTORNEY
Each person whose individual signature appears below hereby authorizes and appoints John J. Nicols and Douglas T. Sheehy, and each of them, with full power of substitution and resubstitution and full power to act without the other, as his or her true and lawful attorney-in-fact and agent to act in his or her name, place and stead and to execute in the name and on behalf of each person, individually and in each capacity stated below, and to file any and all amendments to this annual report on Form 10-K and to file the same, with all exhibits thereto, and other documents in connection therewith, with the Securities and Exchange Commission, granting unto said attorneys-in-fact and agents, and each of them, full power and authority to do and perform each and every act and thing, ratifying and confirming all that said attorneys-in-fact and agents or any of them or their or his substitute or substitutes may lawfully do or cause to be done by virtue thereof.
Pursuant to the requirements of the Securities Exchange Act of 1934, this report has been signed below by the following persons on behalf of the registrant and in the capacities and on the dates indicated.
92
SIGNATURE |
TITLE |
DATE |
||
/s/ John J. Nicols
|
President, Chief Executive Officer and Director |
Date: March 12, 2014 |
||
John J. Nicols |
(Principal Executive Officer) |
|||
/s/ David D. O'Toole |
Senior Vice President and Chief Financial Officer |
Date: March 12, 2014 |
||
David D. O'Toole |
(Principal Financial and Accounting Officer) |
|||
/s/ Thomas R. Baruch |
Chairman of the Board of Directors |
Date: March 12, 2014 |
||
Thomas R. Baruch |
||||
/s/ Byron L. Dorgan |
Director |
Date: March 12, 2014 |
||
Byron L. Dorgan |
||||
Director |
Date: March 12, 2014 |
|||
Alexander A. Karsner |
||||
/s/ Bernard J. Kelley |
Director |
Date: March 12, 2014 |
||
Bernard J. Kelley |
||||
Director |
Date: March 12, 2014 |
|||
Pedro I. Mizutani |
||||
/s/ Dennis P. Wolf |
Director |
Date: March 12, 2014 |
||
Dennis P. Wolf |
||||
/s/ Patrick Y. Yang |
Director |
Date: March 12, 2014 |
||
Patrick Y. Yang |
||||
93
EXHIBIT INDEX
|
Exhibit
No.
|
Description |
|
3.1 |
Amended and Restated Certificate of Incorporation of Codexis, Inc. filed with the Secretary of the State of the State of Delaware on April 27, 2010 and effective as of April 27, 2010 (incorporated by reference to Exhibit 3.1 to the Company's Quarterly Report on Form 10-Q for the quarter ended March 31, 2010, filed on May 28, 2010). |
|
3.2 |
Certificate of Designations of Series A Junior Participating Preferred Stock of Codexis, Inc., filed with the Secretary of State of the State of Delaware on September 4, 2012 (incorporated by reference to Exhibit 3.1 to the Company's Current Report on Form 8-K, filed on September 4, 2012). |
|
3.3 |
Amended and Restated Bylaws of Codexis, Inc. effective as of April 27, 2010 (incorporated by reference to Exhibit 3.2 to the Company's Quarterly Report on Form 10-Q for the quarter ended March 31, 2010, filed on May 28, 2010). |
|
4.1 |
Form of the Registrant's Common Stock Certificate (incorporated by reference to Exhibit 4.1 to the Company's Quarterly Report for the quarter ended June 30, 2012, filed on August 9, 2012). |
|
4.2* |
Fourth Amended and Restated Investor Rights Agreement dated November 13, 2007. |
|
4.3* |
Form of Warrant to purchase shares of Series D preferred stock issued in connection with the Bridge Loan Agreement dated as of May 25, 2006. |
|
4.4* |
Form of Warrant to purchase shares of Series D preferred stock issued in connection with the Loan and Security Agreement dated as of September 28, 2007. |
|
4.5* |
Warrant to purchase shares of Common Stock issued to Alexandria Equities, LLC. |
|
4.6* |
Registration Rights Agreement among the Company, Jülich Fine Chemicals GmbH and the other parties named therein, dated February 11, 2005. |
|
4.7* |
Fifth Amended and Restated Voting Agreement dated March 4, 2009. |
|
4.8* |
Amendment to Fifth Amended and Restated Voting Agreement dated February 25, 2010. |
|
10.1A†* |
Amended and Restated Collaborative Research Agreement by and between the Company and Equilon Enterprises LLC dba Shell Oil Products US effective as of November 1, 2006. |
|
10.1B†* |
Amendment to the Amended and Restated Collaborative Research Agreement by and between the Company and Equilon Enterprises LLC dba Shell Oil Products US effective as of March 4, 2009. |
|
10.1C†* |
Amendment No. 2 to the Amended and Restated Collaborative Research Agreement, by and between the Company and Equilon Enterprises LLC dba Shell Oil Products US effective as of February 23, 2010. |
|
10.2A†* |
Amended and Restated License Agreement by and between the Company and Equilon Enterprises LLC dba Shell Oil Products US effective as of November 1, 2006. |
|
10.2B* |
Amendment to the Amended and Restated License Agreement by and between the Company and Equilon Enterprises LLC dba Shell Oil Products US effective as of March 4, 2009. |
|
10.2C†* |
Exclusive Negotiation Agreement by and between the Company and Equilon Enterprises LLC dba Shell Oil Products US effective as of July 10, 2012 (incorporated by reference to Exhibit 10.1 to the Company's Quarterly Report on Form 10-Q for the quarter ended September 30, 2012, filed on November 7, 2012). |
|
10.2D* |
Agreement by and between the Company and Equilon Enterprises LLC dba Shell Oil Products US effective as of August 31, 2012 (incorporated by reference to Exhibit 10.2 to the Company's Quarterly Report on Form 10-Q for the quarter ended September 30, 2012, filed on November 7, 2012). |
|
10.3†* |
Collaborative Research and License Agreement by and among the Company, Iogen Energy Corporation and Equilon Enterprises LLC dba Shell Oil Products US effective as of July 10, 2009. |
|
94
|
Exhibit
No.
|
Description |
|
10.4†* |
License Agreement by and among the Company, Dyadic International (USA), Inc. and Dyadic International, Inc. effective as of November 14, 2008. |
|
10.5A†* |
Product Supply Agreement by and between Codexis Laboratories India Private Limited and Arch Pharmalabs Limited, effective as of February 16, 2010. |
|
10.5B†* |
Enzyme and Product Supply Agreement by and between the Company and Arch Pharmalabs Limited, effective as of February 16, 2010. |
|
10.5C†* |
Memorandum of Understanding for Transfer Pricing and Royalty Calculation by and between the Company and Arch Pharmalabs Limited, effective as of February 16, 2010. |
|
10.5D†* |
Memorandum of Understanding for Transfer Pricing by and between Codexis Laboratories India Private Limited and Arch Pharmalabs Limited, effective as of February 16, 2010. |
|
10.5E |
Letter Amendment to the Enzyme and Product Supply Agreement by and between the Company and Arch Pharmalabs Limited dated as of April 22, 2011 (incorporated by reference to Exhibit 10.1 to the Company's Quarterly Report on Form 10-Q for the quarter ended September 30, 2011, filed on November 7, 2011). |
|
10.5F |
Letter Amendment to the Product Supply Agreement by and between Codexis Laboratories India Private Limited and Arch Pharmalabs Limited dated as of April 22, 2011 (incorporated by reference to Exhibit 10.2 to the Company's Quarterly Report on Form 10-Q for the quarter ended September 30, 2011, filed on November 7, 2011). |
|
10.5G† |
Amendment No. 1 to the Memorandum of Understanding for Transfer Pricing and Royalty Calculation by and between the Company and Arch Pharmalabs Limited effective as of April 25, 2011 (incorporated by reference to Exhibit 10.3 to the Company's Quarterly Report on Form 10-Q for the quarter ended September 30, 2011, filed on November 7, 2011). |
|
10.5H† |
Amendment No. 1 to the Memorandum of Understanding for Transfer Pricing by and between Codexis Laboratories India Private Limited and Arch Pharmalabs Limited effective as of April 25, 2011 (incorporated by reference to Exhibit 10.4 to the Company's Quarterly Report on Form 10-Q for the quarter ended September 30, 2011, filed on November 7, 2011). |
|
10.5I† |
Omnibus Letter Amendment to the Enzyme and Product Supply Agreement by and between the Company and Arch Pharmalabs Limited and the Product Supply Agreement by and between Codexis Laboratories India Private Limited and Arch Pharmalabs Limited dated as of August 17, 2011 (incorporated by reference to Exhibit 10.5 to the Company's Quarterly Report on Form 10-Q for the quarter ended September 30, 2011, filed on November 7, 2011). |
|
10.5J |
Amendment No.1 to Enzyme and Product Supply Agreement by and between the Company and Arch Pharmalabs Limited dated as of January 4, 2012 (incorporated by reference to Exhibit 10.6J to the Company's Annual Report on Form 10-K for the fiscal year ended ended December 31, 2011, filed on March 5, 2012). |
|
10.5K† |
Enzyme Supply Agreement by and between Arch Pharmalabs Limited and the Company dated as of November 1, 2012 (incorporated by reference to Exhibit 10.5K to the Company's Annual Report on Form 10-K for the fiscal year ended ended December 31, 2012, filed on April 2, 2013). |
|
10.6A* |
Lease Agreement by and between the Company and Metropolitan Life Insurance Company dated as of February 1, 2004. |
|
10.6B* |
Amendment to Lease Agreement by and between the Company and Metropolitan Life Insurance Company dated as of June 1, 2004. |
|
10.6C* |
Amendment to Lease Agreement by and between the Company and Metropolitan Life Insurance Company dated as of March 9, 2007. |
|
10.6D* |
Amendment to Lease Agreement by and between the Company and Metropolitan Life Insurance Company dated as of March 31, 2008. |
|
95
|
Exhibit
No.
|
Description |
|
10.6E |
Fourth Amendment to Lease Agreement by and between the Company and Metropolitan Life Insurance Company dated as of September 17, 2010 (incorporated by reference to Exhibit 10.1 to the Company’s Quarterly Report on Form 10-Q for the quarter ended September 30, 2010, filed on November 4, 2010). |
|
10.6F |
Fifth Amendment to Lease Agreement by and between the Company and Metropolitan Life Insurance Company dated as of March 16, 2011 (incorporated by reference to Exhibit 10.1 to the Company’s Quarterly Report on Form 10-Q for the quarter ended March 31, 2011, filed on May 6, 2011). |
|
10.6G |
Sixth Amendment to Lease by and between the Company and Metropolitan Life Insurance Company dated as of September 27, 2012 (incorporated by reference to Exhibit 10.6 to the Company's Quarterly Report on Form 10-Q for the quarter ended September 30, 2012, filed on November 7, 2012). |
|
10.7+* |
Codexis, Inc. 2002 Stock Plan, as amended, and Form of Stock Option Agreement. |
|
10.8+* |
Codexis, Inc. 2010 Equity Incentive Award Plan and Form of Stock Option Agreement. |
|
10.9+ |
Transition and Separation Agreement by and between the Company and Alan Shaw dated as of February 17, 2012 (incorporated by reference to Exhibit 10.11B to the Company's Annual Report on Form 10-K for the fiscal year ended ended December 31, 2011, filed on March 5, 2012). |
|
10.10+* |
Offer Letter Agreement by and between the Company and Douglas T. Sheehy dated as of February 26, 2007. |
|
10.11+* |
Transition and Separation Agreement by and between the Company and David L. Anton dated as of July 24, 2013 (incorporated by reference to Exhibit 10.1 to the Company’s Quarterly Report on Form 10-Q for the quarter ended June 30, 2013, filed on August 9, 2013). |
|
10.12+* |
Employment Contract by and between the Company and Peter Seufer-Wasserthal dated as of March 6, 2006. |
|
10.13A+* |
Consulting Agreement by and between the Company and Alexander A. Karsner dated as of December 14, 2009. |
|
10.13B+ |
Consulting Agreement by and between the Company and Alexander A. Karsner dated as of January 1, 2014. |
|
10.14* |
Form of Indemnification Agreement between the Company and each of its directors, officers and certain employees. |
|
10.15+* |
Form of Change of Control Severance Agreement between the Company and certain of its officers. |
|
10.16A* |
Letters of Offer and Acceptance, dated as of September 28, 2009, by and between Codexis Laboratories Singapore Pte Ltd and the Economic Development Board of Singapore regarding the grant for the development of the Codexis Gene Shuffling Centre of Excellence. |
|
10.16B† |
Letters of Amendment and Acknowledgment, effective as of August 30, 2011, by and between Codexis Laboratories Singapore Pte Ltd and the Economic Development Board of Singapore regarding the grant from the development of the Codexis Gene Shuffling Centre of Excellence (incorporated by reference to Exhibit 10.6 to the Company's Quarterly Report on Form 10-Q for the quarter ended September 30, 2011, filed on November 7, 2011).
|
|
10.16C |
Letters of Amendment and Acknowledgment, effective as of May 22, 2012, by and between Codexis Laboratories Singapore Pte Ltd and the Economic Development Board of Singapore regarding the award from the development of the Codexis Gene Shuffling Centre of Excellence (incorporated by reference to Exhibit 10.1 to the Company's Quarterly Report on Form 10-Q for the quarter ended June 30, 2012, filed on August 9, 2012). |
|
10.17 |
Asset Purchase Agreement, dated October 28, 2010, by and among the Company, Codexis Mayflower Holdings, LLC and Maxygen, Inc. (incorporated by reference to Exhibit 2.1 to the Company’s Current Report on Form 8-K, filed on October 28, 2010). |
|
10.18A† |
Manufacture and Supply Agreement, dated May 16, 2011, by and between the Company and Lactosan GmbH & Co. KG (incorporated by reference to Exhibit 10.1 to the Company’s Quarterly Report on Form 10-Q for the quarter ended June 30, 2011, filed on August 3, 2011). |
|
96
|
Exhibit
No.
|
Description |
|
10.18B |
Amendment No. 1 to the Manufacture and Supply Agreement by and between the Company and Lactosan GmbH & Co. KG dated as of March 9, 2012 (incorporated by reference to Exhibit 10.1 to the Company's Quarterly Report on Form 10-Q for the quarter ended March 31, 2012, filed on May 10, 2012). |
|
10.19A+ |
Employment Agreement by and between the Company and John Nicols effective as of May 28, 2012 (incorporated by reference to Exhibit 10.2 to the Company's Quarterly Report on Form 10-Q for the quarter ended June 30, 2012, filed on August 9, 2012). |
|
10.19B+ |
John Nicols Stock Option Grant Notice and Stock Option Agreement dated June 13, 2012 between John J. Nicols and the Company (incorporated by reference to Exhibit 10.3 to the Company's Quarterly Report on Form 10-Q for the quarter ended June 30, 2012, filed on August 9, 2012). |
|
10.19C+ |
John Nicols Restricted Stock Grant Notice and Restricted Stock Agreement dated June 13, 2012 between John J. Nicols and the Company (incorporated by reference to Exhibit 10.4 to the Company's Quarterly Report on Form 10-Q for the quarter ended June 30, 2012, filed on August 9, 2012). |
|
10.20A+ |
Offer Letter Agreement by and between the Company and David O'Toole effective as of September 1, 2012 (incorporated by reference to Exhibit 10.3 to the Company's Quarterly Report on Form 10-Q for the quarter ended September 30, 2012, filed on November 7, 2012). |
|
10.20B+ |
David O'Toole Stock Option Grant Notice and Stock Option Agreement dated September 10, 2012 between David O'Toole and the Company (incorporated by reference to Exhibit 10.4 to the Company's Quarterly Report on Form 10-Q for the quarter ended September 30, 2012, filed on November 7, 2012). |
|
10.20C+ |
David O'Toole Restricted Stock Grant Notice and Restricted Stock Agreement dated September 10, 2012 between David O'Toole and the Company (incorporated by reference to Exhibit 10.5 to the Company's Quarterly Report on Form 10-Q for the quarter ended September 30, 2012, filed on November 7, 2012). |
|
|
10.21A†
|
Sitagliptin Catalyst Supply Agreement by and between Merck Sharp and Dohme Corp. and the Company dated as of February 1, 2012 (incorporated by reference to Exhibit 10.25 to the Company's Annual Report on Form 10-k for the year ended December 31, 2012, filed on April 2, 2013). |
|
10.21B† |
Amendment to Sitagliptin Catalyst Supply Agreement between Merck Sharp and Dohme Corp. and the Company dated as of October 1, 2013 (incorporated by reference to Exhibit 10.2 to the Company’s Quarterly Report on Form 10-Q for the quarter ended September 30, 2013, filed on November 12, 2013). |
|
10.22A† |
License Agreement by and between Exela PharmSci, Inc. and the Company effective as of September 18, 2007 (incorporated by reference to Exhibit 10.26A to the Company's Annual Report on Form 10-K for the fiscal year ended ended December 31, 2012, filed on April 2, 2013). |
|
10.22B† |
Amendment No. 1 to the License Agreement between Exela PharmaSci, Inc. and the Company effective as of December 28, 2009(incorporated by reference to Exhibit 10.26B to the Company's Annual Report on Form 10-K for the year ended December 31, 2012, filed on April 2, 2013) . |
|
10.23+ |
Transition and Separation Agreement between the Company and Matthew B. Tobin dated as of December 4, 2013. |
|
21.1 |
List of Subsidiaries. |
|
23.1 |
Consent of Ernst & Young LLP, independent registered public accounting firm |
|
23.2 |
Consent of BDO USA, LLP, independent registered public accounting firm |
|
24.1 |
Power of Attorney (see signature page to the this Annual Report on Form 10-K). |
|
31.1 |
Certification of Principal Executive Officer Required Under Rule 13a-14(a) and 15d-14(a) of the Securities Exchange Act of 1934, as amended. |
|
31.2 |
Certification of Principal Financial Officer Required Under Rule 13a-14(a) and 15d-14(a) of the Securities Exchange Act of 1934, as amended. |
|
97
|
Exhibit
No.
|
Description |
|
32.1 ** |
Certification of Principal Executive Officer and Principal Financial Officer Required Under Rule 13a-14(b) of the Securities Exchange Act of 1934, as amended, and 18 U.S.C. §1350. |
|
101 |
The following materials from Registrant's Annual Report on Form 10-K for the fiscal year ended December 31, 2013, formatted in Extensible Business Reporting Language (XBRL) includes: (i) Consolidated Balance Sheets at December 31, 2013 and December 31, 2012, (ii) Consolidated Statements of Income for the years ended December 31, 2013, December 31, 2012 and December 31, 2011, (iii) Consolidated Statements of Comprehensive Income for the years ended December 31, 2013, December 31, 2012 and December 31, 2011, (iv) Consolidated Statements of Cash Flows for the years ended December 31, 2013, December 31, 2012 and December 31, 2011, (v) Consolidated Statements of Stockholders' Equity for the years ended December 31, 2013, December 31, 2012 and December 31, 2011 and (vi) Notes to Condensed Consolidated Financial Statements. |
|
+ |
Indicates a management contract or compensatory plan or arrangement. |
† |
Confidential treatment has been granted for certain information contained in this exhibit. Such information has been omitted and filed separately with the Securities and Exchange Commission. |
* |
Filed as exhibits to the registrant’s Registration Statement on Form S-1 (File No. 333-164044), effective April 21, 2010, and incorporated herein by reference. |
** |
Pursuant to Item 601(b)(32) of Regulation S-K this exhibit is furnished rather than filed with this report. |
98